Ivor Cummins aka the Fat Emperor – gives James the lowdown on why you can’t trust anything our governments tell us about Covid-19. If you want the facts on Coronavirus – how deadly is it? do lockdowns and masks work? how does it compare with previous pandemics? – you’ve come to the right place
This is my first podcast and they will improve. This is Part 1 and it describes how COVID may grow exponentially and how we flatten the growth curve.
Part 2: Curve Fitting for Understanding
This is Part 2. Fitting viral growth data with simple mathematical functions can give important insights into how epidemics will grow. Here we illustrate two commonly used growth curves, the Sigmoid Function and the Gompertz Function. While superficially similar, they are really very different.
Part 3: COVID19 Never Grows Exponentially
Part 3. The total case numbers in South Korea and New Zealand have exponential growth rates that decrease linearly on a log-scale. This is not ever exponential growth.
“There are really only two particularly unusual things about the Covid-19 epidemic: the timing of its arrival and the lockdown some countries declared.”
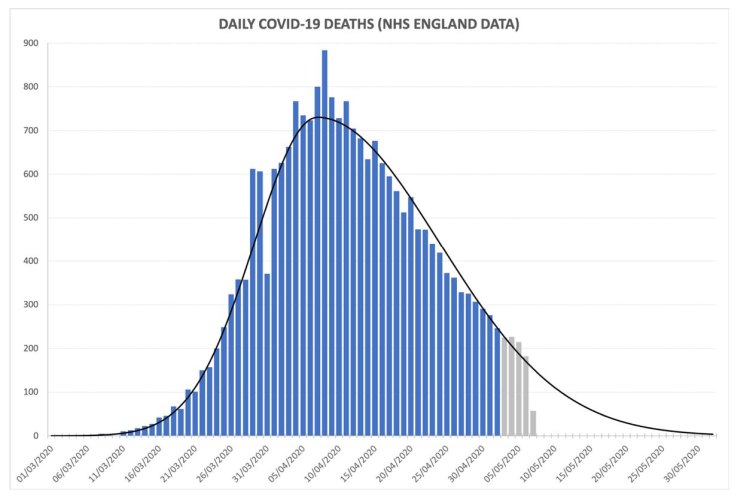
Deaths per day, as is well-reported, peaked around Easter; and because deaths lag infections by something around three weeks, this implies that infections peaked sometime in mid-March. If you add up all the bars in the chart and fill in the blank area of deaths still to come, we are looking at a killer that, in scale, is bad-but-nothing-special compared to killers of previous years. Panning out: as a killer worldwide, it looks as though Covid is going to take a toll perhaps 1% of 1918’s Spanish Flu.
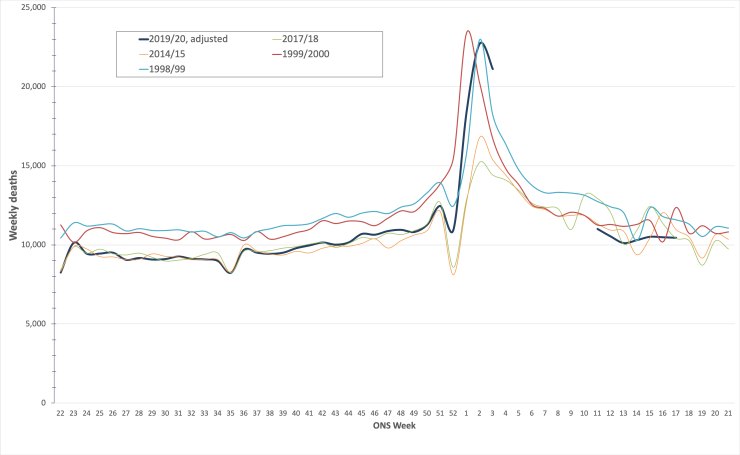
…the dark blue line is 2019-20, with Covid-19; the turquoise and red lines are the bad flu years of 1998-99 and 1999-2000.
…Covid-19 is narrowly in third place as a killer to remember, behind the 1998-99 and 1999-2000 influenzas (2017-18’s ‘Beast from the East’, the green line, doesn’t place), a point also made by American statistician William Briggs.
The spread of COVID-19 is not going to follow an exponential curve – and grave errors will follow if analysts believe it will. The number of new cases rises rapidly, peaks, and then declines. It’s called the epidemiological curve. It’s not a theory or hypothesis; it plays out that way every flu season. It is how it has played out in China and Korea for COVID-19. Flattening the peak to avoid overloading the healthcare system is the main medical goal of the seemingly extreme containment policies we have seen to date.
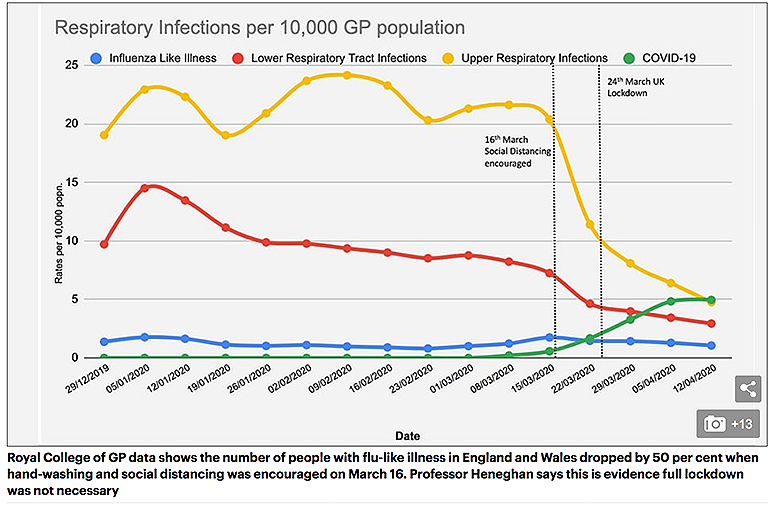
Oxford University Professor Carl Heneghan: UK’s outbreak peaked in March before lockdown but ministers had ‘lost sight’ of the scientific evidence and panicked.
Andrew Mather, a mathematician and financier based in the UK, explains how the official data clearly showed that the COVID-19 crisis was over in the UK before the lock-down.
Andrew Mather, a mathematician and financier based in the UK, offers a series of videos analysing the COVID-19 data released by various governmental and health bodies.
In this video, he presents how the government had access to data that the case-count growth rate was decelerating long before the UK lockdown.
Traffic log cookies are used to measure site traffic. We'll assume you're ok with this, but you can opt-out if you wish. Cookie settingsACCEPT
Privacy & Cookies Policy
Privacy Overview
This website uses cookies to improve your experience while you navigate through the website. Out of these cookies, the cookies that are categorized as necessary are stored on your browser as they are essential for the working of basic functionalities of the website. We also use third-party cookies that help us analyze and understand how you use this website. These cookies will be stored in your browser only with your consent. You also have the option to opt-out of these cookies. But opting out of some of these cookies may have an effect on your browsing experience.
Necessary cookies are absolutely essential for the website to function properly. This category only includes cookies that ensures basic functionalities and security features of the website. These cookies do not store any personal information.
Any cookies that may not be particularly necessary for the website to function and is used specifically to collect user personal data via analytics, ads, other embedded contents are termed as non-necessary cookies. It is mandatory to procure user consent prior to running these cookies on your website.