Categories
Opinion Videos

Ivor Cummins on The James Delingpole Channel

Ivor Cummins aka the Fat Emperor – gives James the lowdown on why you can’t trust anything our governments tell us about Covid-19. If you want the facts on Coronavirus – how deadly is it? do lockdowns and masks work? how does it compare with previous pandemics? – you’ve come to the right place

Please support the Delingpod:

Mirror archives are available below if this video is removed from YouTube.

Categories
Opinion Videos

Dr. Mike Yeadon on The James Delingpole Channel

https://youtu.be/sbMJoJ6i39k

Interview highlights

  • COVID-19 is not a dread disease that will kill everyone.
  • The initially high case fatality rate of COVID-19 was because the medical community didn’t know how to treat it.
  • The fatality rate of flu is 0.1% (1 in every 1,000 who are infected end up dying).
  • Ventilators are the wrong option if you do not have an obstructed airway disease.
  • Prod. Ioannidis: The infection fatality ratio of COVID-19 is 0.15%. This is pretty much the same as the flu.
  • We should just ask people to be careful but otherwise go about your daily life.
  • These things pass every year. This is the first ‘social media pandemic.’
  • The normal practice for intensive care beds in the NHS is to run them almost full. This is because a lot of intensive care bed assignment is planned.
  • ICU use at the height of the pandemic was has very low because the NHS was run as light as possible to cope with a second wave.
  • Respiratory viruses don’t do waves.
  • This is not opinion but is basic understanding among experts in the field. It is supposrted by the highest quality science. Sir Patrick Vallance knows this.
  • COVID-19 follows the Gompertz Curve.
  • You have immunity after your body has fought off a respiratory virus. If that was not the case, you’d be dead. Immunity probably lasts decades based on evidence from other viruses.
  • Gompertz Curve is identical in all heavily infection regions.
  • Something awefull happened in the middle of the year: PCR swab test.
  • It is not true that if you test more people you’ll save more lives. A certain percentage of the test will come up positive even if there’s no virus in you.
  • False positive rate wasn’t released.
  • Kate Barker wrote in a government document on June 3rd, 2020, to SAGE: test has an unknown false positive rate; based on similar tests it may be between 1%-2%. This is a big deal.
  • Based on 1%: for every 1,000 people you test, 10 will come back positive, even if they don’t have the virus. If prevalence is only 0.1% as reported by ONS, only 1 in 1,000 will be genuine. This means 9 in 10–in other words 90%–are false.
  • Pillar 2 testing would have caused of the most of the positives to be false.
  • 1,700 people die normally every day in the UK. During the summer, only about 10 were dying per day of covid.
  • More testing, more false positives. We’ll never escape covid if we keep testing because most of the positives will be false. This is immunology 101. Sir Patrick Vallance would have known this.
  • Influenza is a high mutation-rate virus. Coronaviruses are relatively stable so once you’ve recovered, you are probably immune for decades.
  • COVID-19 kills 0.15%-0.2%, slightly more lethal than the average flu. Once it’s gone through the population, it won’t come back.
  • 99.94% survive COVID-19 and will be resistant for a long time.
  • COVID-19 is 80% similar to SARS-COV-1.
  • People who were exposed to SARS have T-cell immunity 17 years later. Evidence for COVID-19 all point in direction.
  • Our bodies have many lines of defense, including innate immunity and T-cells. Antibodies are in the last line of defense.
  • Study shows around 30% prior immunity to SARS-COV-2. It was due to exposure to common-cold coronaviruses.
  • The claim made by Sir Patrick Vallance that more than 90% are susceptible is a lie.
  • Mass testing of the well populating is the worst problem as it generates false positives, fear and control.
  • If you’re immune, you can’t be infected or infectious. Herd immunity is already in play in London.
  • If SAGE is correct, London should be ‘ablaze’ with deaths.
  • Current testing methods are not forensically sound.
  • Tests detect common cold and dead virus.
  • SARS-COV-2 has never really been a public health emergency.
  • We do not need the vaccine to return to normal. Most people are not in danger from COVID-19. More people are in danger from car crashes and we accept that risk.
  • Best case scenario is that the vaccine is 50% effective. Natural immunity might be better.
  • The most vulnerable often don’t respond well to vaccines and die anyway.
  • SAGE is giving lethally wrong advice.
  • The reason the pandemic is not over is because SAGE says it’s not.

Categories
Opinion

Near identical dynamics for England, Sweden, Spain – Professor Paul Dennis

Professor Paul Dennis, a geologist and isotope geochemist at the University of East Anglia, compared the deaths in England, Sweden, Spain. He found near identical dynamics, which supports the theory that COVID-19 appears to follow the Gompertz curve in every outbreak region. This implies that social distancing and lockdown has no effect.

https://twitter.com/PFDgeologist/status/1267406710597189632
Categories
Publications

Universality in COVID-19 spread in view of the Gompertz function – medRxiv

COVID-19 appears to follow the Gompertz curve in every outbreak region. This means that government interventions do nothing to stop the virus.

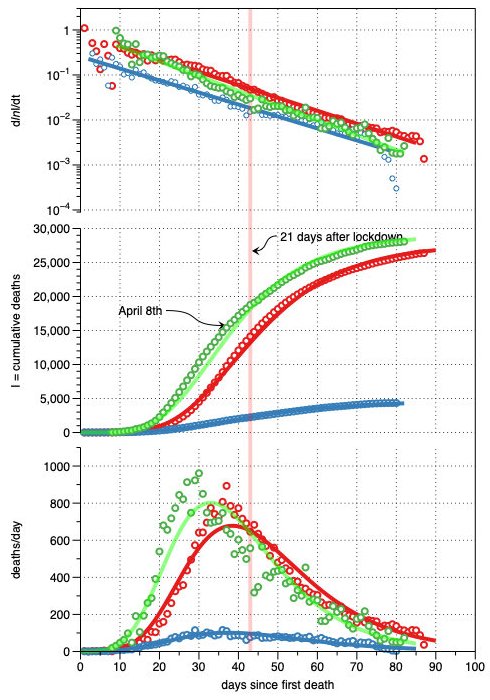
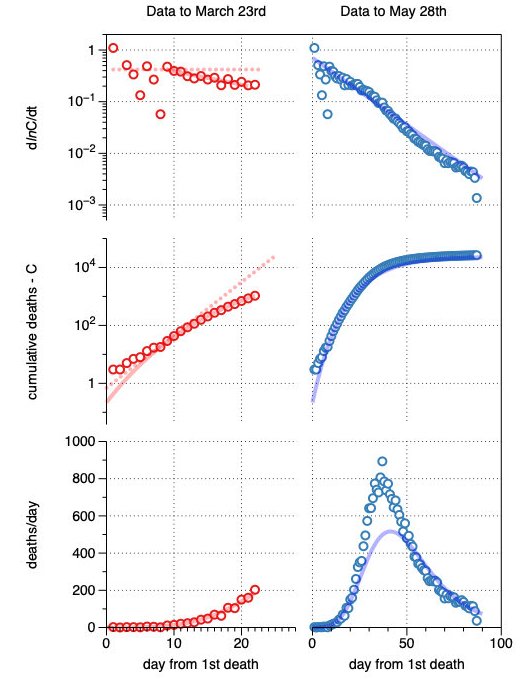
We demonstrate that universal scaling behavior is observed in the current coronavirus (COVID-19) spread in various countries. We analyze the numbers of infected people in selected eleven countries (Japan, USA, Russia, Brazil, China, Italy, Indonesia, Spain,South Korea, UK, and Sweden). By using the double exponential function called the Gompertz function, fG(x)=exp(−e−x), the number of infected people is well described as N(t)=N0 fG(γ(t−t0)), where N0, γ and t0 are the final total number of infected people, the damping rate of the infection probability and the peak time of dN(t)/dt, respectively. The scaled data of infected people in most of the analyzed countries are found to collapse onto a common scaling function fG(x) with x=γ(t−t0) in the range of fG(x) ± 0.05. The recently proposed indicator so-called the K value, the increasing rate of infected people in one week, is also found to show universal behavior. The mechanism for the Gompertz function to appear is discussed from the time dependence of the produced pion numbers in nucleus-nucleus collisions, which is also found to be described by the Gompertz function.

https://www.medrxiv.org/content/10.1101/2020.06.18.20135210v1

Categories
Opinion

Stockholm data shows virus burns out when it has infected 15-20% of the population

@gummibear737, a Twitter use who has been analysing COVID-19 data, has published a chart that confirms a hypothesis by Dr Michael Levitt:

Stockholm is the best population to test Covid theory whereby it was hit hard early and did not have lockdowns. Nobel Prize winner Dr Michael Levitt postulated that the virus burns out when it has infected 15-20% of the population. According to this, he’s right.

So what does this mean? Lockdowns were a waste of time and resources. Minimizing deaths just delays the inevitable. Those countries which were not hit are most likely to see continued spikes and outbreaks. Maybe less during the summer but a second wave later this year.

Categories
Publications

A Mystery of the Gompertz Function

The Gompertz function describes global dynamics of many natural processes including growth of normal and malignant tissues. On one hand, the Gompertz function defines a fractal. The fractal structure of time-space is a prerequisite condition for the coupling and Gompertzian growth. On the other hand, the Gompertz function is a probability function. Its derivative is a probability density function. Gompertzian dynamics emerges as a result of the co-existence of at least two antagonistic processes with the complex coupling of their probabilities. This dynamics implicates a coupling between time and space through a linear function of their logarithms. The spatial fractal dimension is a function of both scalar time and the temporal fractal dimension. The Gompertz function reflects the equilibrium between regular states with predictable dynamics and chaotic states with unpredictable dynamics; a fact important for cancer chemoprevention. We conclude that the fractal-stochastic dualism is a universal natural law of biological complexity.

https://link.springer.com/chapter/10.1007/3-7643-7412-8_27

Categories
Videos

COVID19 Never Grows Exponentially – Professor Michael Levitt

Part 1: Exponential Growth is Terrifying

This is my first podcast and they will improve. This is Part 1 and it describes how COVID may grow exponentially and how we flatten the growth curve.

Part 2: Curve Fitting for Understanding

This is Part 2. Fitting viral growth data with simple mathematical functions can give important insights into how epidemics will grow. Here we illustrate two commonly used growth curves, the Sigmoid Function and the Gompertz Function. While superficially similar, they are really very different.

Part 3: COVID19 Never Grows Exponentially

Part 3. The total case numbers in South Korea and New Zealand have exponential growth rates that decrease linearly on a log-scale. This is not ever exponential growth.

Categories
Publications

Empiric model for short-time prediction of COVID-19 spreading – medRxiv

Covid-19 appearance and fast spreading took by surprise the international community. Collaboration between researchers, public health workers and politicians has been established to deal with the epidemic. One important contribution from researchers in epidemiology is the analysis of trends so that both current state and short-term future trends can be carefully evaluated. Gompertz model has shown to correctly describe the dynamics of cumulative confirmed cases, since it is characterized by a decrease in growth rate that is able to show the effect of control measures. Thus, it provides a way to systematically quantify the Covid-19 spreading velocity. Moreover, it allows to carry out short-term predictions and long-term estimations that may facilitate policy decisions and the revision of in-place confinement measures and the development of new protocols. This model has been employed to fit the cumulative cases of Covid-19 from several Chinese provinces and from other countries with a successful containment of the disease. Results show that there are systematic differences in spreading velocity between countries. In countries that are in the initial stages of the Covid-19 outbreak, model predictions provide a reliable picture of its short-term evolution and may permit to unveil some characteristics of the long-term evolution. These predictions can also be generalized to short-term hospital and Intensive Care Units (ICU) requirements, which together with the equivalent predictions on mortality provide key information for health officials.

https://www.medrxiv.org/content/10.1101/2020.05.13.20101329v1

Categories
Publications

Time variations in the transmissibility of pandemic influenza in Prussia, Germany, from 1918–19 – BMC (2017)

The COVID-19 epidemic curves are consistent and follow the Gompertz curve. Similar distributions have been reported for Influenza, such as the 1918/19 epidemic in Prussia.

Epidemic curve of pandemic influenza in Prussia, Germany, from 1918–19. Reported daily number of influenza deaths (solid line) and the back-calculated temporal distribution of onset cases (dashed line). Daily counts of onset cases were obtained using the time delay distribution from onset to death (see Table 1). Data source: ref [18] (see [Additional file 1]).

https://tbiomed.biomedcentral.com/articles/10.1186/1742-4682-4-20