A senior epidemiologist who advised the government during the coronavirus pandemic claims he was told to “correct” his views after he criticised what he thought was an “implausible” graph shown at an official briefing.
Professor Mark Woolhouse has also apologised to his daughter, whose generation “has been so badly served by mine”, and believes that closing schools was “morally wrong”.
The Edinburgh University academic is deeply critical of the use of lockdown measures and says “plain common sense” was a “casualty of the crisis”.
Speaking to Sky News, Prof Woolhouse seemed concerned about a possible “big-brother” approach to the control of information about COVID.He says he was told to watch what he was saying following a briefing given by Chief Scientific Adviser (CSA) Sir Patrick Vallance on 21 September 2020.
Exponential growth
Official statistics from all countries where data is available show that COVID-19 does not ‘grow exponentially’. In fact, COVID-19 appears to follow the Gompertz curve in every outbreak region.
Browse the articles related to this topic below.
Join our community on Guilded.
Admissions have failed to sky-rocket – and it’s time ministers took their own advice about learning to live with the virus
Laura Dodsworth interviews Alistair Haimes on Freethinking with Laura Dodsworth.
Support Laura Dodsworth through Patreon:
https://www.patreon.com/lauradodsworth
Interview notes and charts
- The difference between what the government was telling us and what their information was telling us was so extreme and outrageous.
- Exponential means a “constant rate of growth.” The government data in March was clearly showing that the COVID-19 was declining, not growing exponentially. This was the same in all countries you could see the data. [See chart 1]
- A constantly declining growth rate will make a bell curve. The government were standing in front of bell curve graphs during their briefings yet they were telling us we were in the middle of the epidemic.
- It was very clear that we were heading to a peak sometime around early to mid-April.
- You don’t have to be complicated mathematics to see that COVID-19 was running out of steam almost from day one.
- The conclusion from the Centre for Evidence-Based Medicine seems to be that it’s impossible to predict if there will be a second wave.
- Sweden’s epidemic looks identical to the UK’s but they did not lockdown. Their datapoint indicates there won’t be a second wave. There has been no spike in Denmark either. [See chart 2]
- Unknowns: has summer affected COVID-19 and will there be a mutation?
- Will illnesses during the autumn and winter be mis-attributed to COVID-19? Poor media coverage means that we can’t be sure.
- Symptoms of COVID-19 are very similar to the flu. Something could look like a second wave but will we really know?
- The lockdown is costing a Brexit bill a week.
- The government response seems to have been skewed by Neil Ferguson’s modelling data. The make-up of government advisors seems to be a recipe for groupthink, which is very dangerous.
- Epidemiology (the way a disease spreads through the population) is not complicated science. The government could have had lots of people who were very good at this but they didn’t.
- We should have cocooned the vulnerable, make sure the NHS has capacity and “let it rip” through the population.
- We should never have had an open-ended lockdown.
- The ‘R number’ is just the difference of in the number of people infected after each generation of a disease. Britain crossed the ‘magical R of 1’ line a few days before lockdown and the same day as Sweden. Whatever interventions have been done doesn’t seem to have had any effect. [See chart 3]
- COVID-19 is mostly a care home and hospital disease. This was obvious very early on. Old people should not have been moved from hospitals into care homes. It seems as if we knowingly seeded the most vulnerable environment with the disease.
- 37% of our deaths are care home residents but they are only 0.5% of our population. Of them are dementia sufferers.
- Over 20% of the infections were picked up in the hospitals. COVID-19 seems more like MRSA than influenza in that it’s an infection control problem.
- COVID-19 is much more comparable to flu for the rest of the population.
- 1968 flu killed 80,000 people in the UK.
- This last winter was a low flu winter. It’s quite possible that the people who died of COVID-19 are those who didn’t die.
- If you overlay COVID-19 deaths with the 2000 flu season, they look very similar. [See chart 4]
- 95% of deaths have had another serious disease. Most people have almost no chance of dying from COVID-19.
- If you are under 40, you have more chance of being struck by lightning that dying of COVID-19.
- If you are under 60, you have more chance of drowning.
- At any age, you have more chance of dying on the roads than dying of COVID-19.
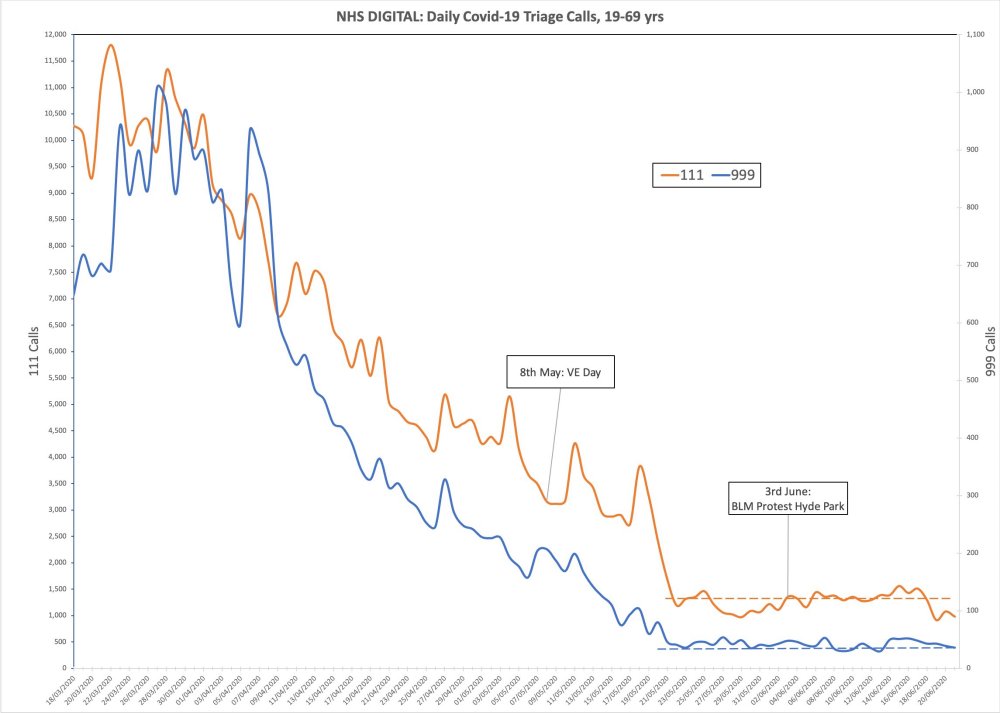
- Lead indicators of 111 and 999 calls with COVID-19 symptoms show there was no spike after VE Day celebrations or BLM protests. In fact, it was even coming down at lockdown. That lockdown was big change for COVID-19 is invisible in the data. [See chart 5]
Charts
Chart 1: COVID-19 was declining in Europe as of march. It was not growing exponentially
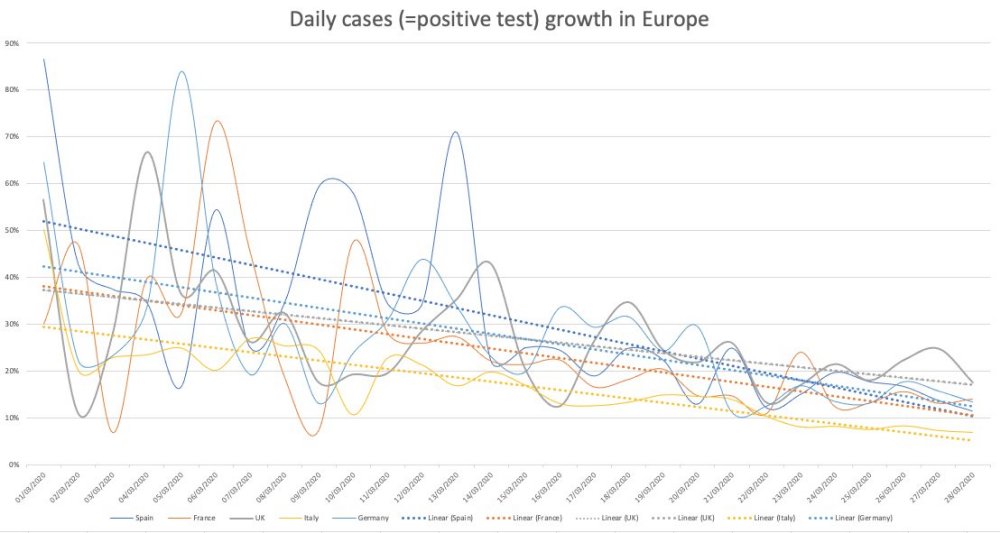
Chart 2: Sweden’s epidemic looks similar to the UK’s but they did not lock down.
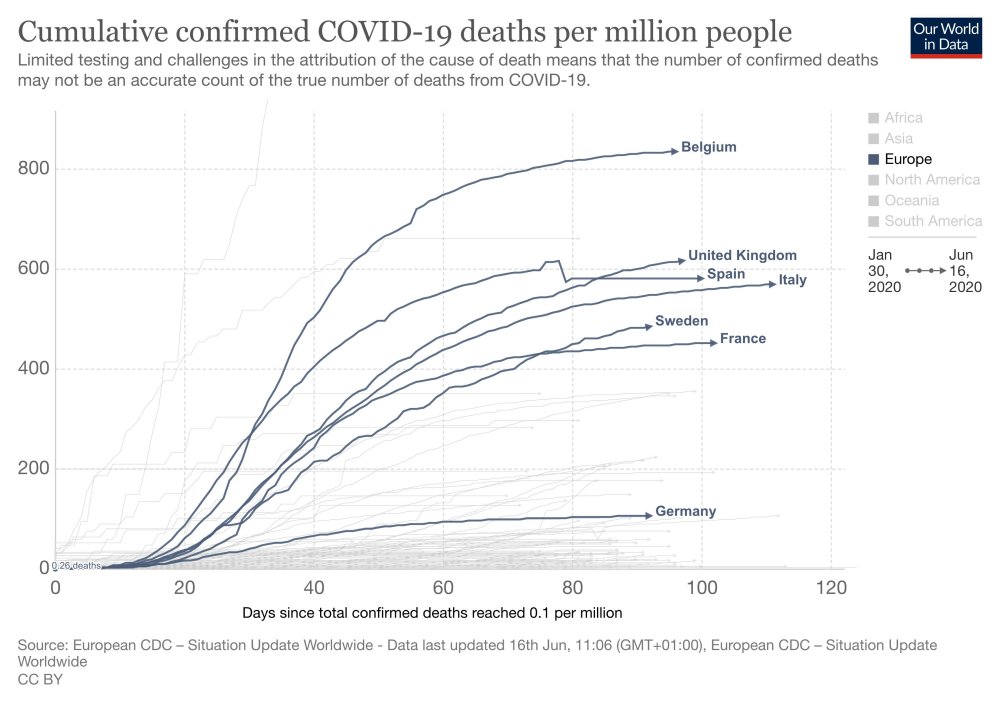
Chart 3: Britain crossed the ‘magical R of 1’ line a few days before lockdown

Chart 4: COVID-19 deaths overlayed with the 2000 flu season
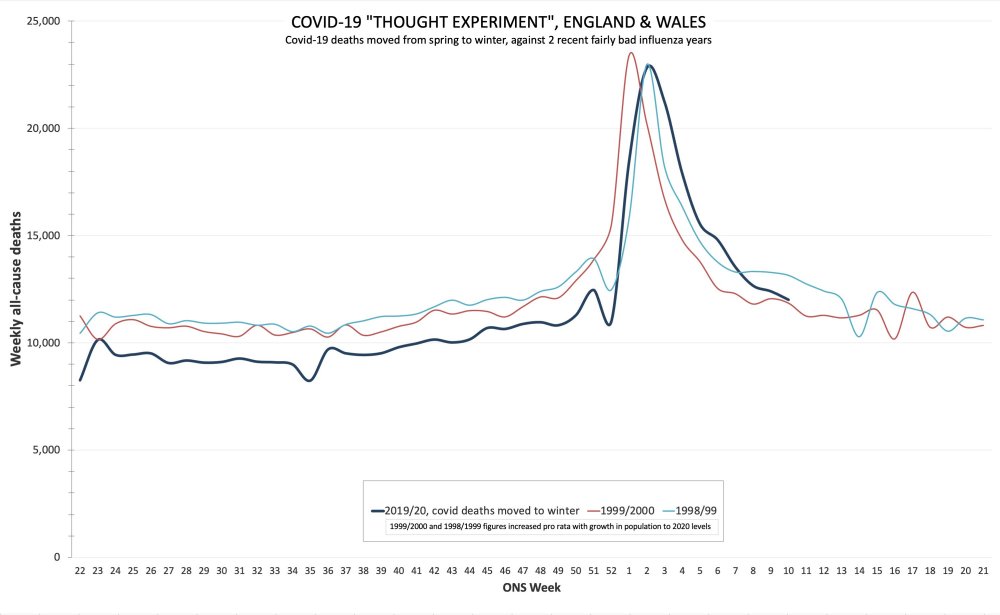
Chart 5: No spike after BLM protests
- Far from following the science, the government turned its back on all available data.
- Until mid-April, with the escalating deaths in care homes agonisingly clear across Europe, government policy was still for patients to be discharged to care homes from hospitals without requiring negative tests. And so the toll: around half of UK Covid-19 deaths are care home residents, despite them accounting for only 0.6 per cent of our population.
- Germany, whose population is roughly 25 per cent bigger than ours, has suffered approximately a quarter of our Covid deaths.
- Ministers have deferred to scientists who themselves deferred to the projections of models, even when data on the ground told a completely different story.
- Statisticians on social media had a field day pointing out the chasm between modelled outcomes and reality, but it is not clear that the models on which SAGE relied (both their input parameters and mechanical dynamics) were continually refined with on-the-ground data (or simply discarded as wrong).
- Why weren’t Oxford’s team, who specialise in zoonotic viruses and who looked at the same data as Neil Ferguson’s modelling-led team but came to wildly different conclusions, on SAGE’s panel to provide an alternative view?
- Why were there no economists on SAGE? Economics is not the bloodless pursuit of money but the science of decision-making under uncertainty where resources are finite; could they really have brought nothing to the party?
- In mid-March, Stanford’s Nobel laureate Michael Levitt (biophysicist and professor of structural biology) discussed the “natural experiment” of the Diamond Princess cruise ship, a petridish disproportionately filled with the most susceptible age and health groups. Even here, despite the virus spreading uncontrolled onboard for at least two weeks, infection only reached a minority of passengers and crew.
- The data towards the end of March clearly showed we were already near the tipping point of the bell-curve (meaning the disease is on the wane). We were already past the point where lockdown could have made much difference.
- Knut Wittkowski: “respiratory diseases [including Covid-19] . . . remain only about two months in any given population”.
https://thecritic.co.uk/issues/july-august-2020/ignoring-the-covid-evidence/
There was no exponential growth in Covid-19 infections the UK. From the first days of the outbreak growth rates were in decline.
The following chart produced by financial strategist Alistair Haimes should put the above question to rest (compare it with the above chart).
The left hand side starts in March 2020 when the UK had had its first 300 infections and then stops at 10 April when Europe as a whole had reached a growth rate of zero or less. The chart is analogous to the above chart of interest rates. If you cannot distinguish the different colours and European countries don’t worry too much (UK is dark blue) as they all show the same overall pattern. The trends are all downwards, from start to finish.

Part 1: Exponential Growth is Terrifying
Part 2: Curve Fitting for Understanding
Part 3: COVID19 Never Grows Exponentially
With a purely statistical perspective, [Prof Michael Levitt] has been playing close attention to the Covid-19 pandemic since January, when most of us were not even aware of it. He first spoke out in early February, when through analysing the numbers of cases and deaths in Hubei province he predicted with remarkable accuracy that the epidemic in that province would top out at around 3,250 deaths.
Nobel prize-winning scientist: the Covid-19 epidemic was never exponential”
There has been a repeated claim in media and on social media that death rates from the worldwide Covid-19 outbreak are spiking in Sweden, a country that has not implemented the measures termed ‘lockdown’.
The spread of COVID-19 is not going to follow an exponential curve – and grave errors will follow if analysts believe it will. The number of new cases rises rapidly, peaks, and then declines. It’s called the epidemiological curve. It’s not a theory or hypothesis; it plays out that way every flu season. It is how it has played out in China and Korea for COVID-19. Flattening the peak to avoid overloading the healthcare system is the main medical goal of the seemingly extreme containment policies we have seen to date.
https://voxeu.org/article/it-s-not-exponential-economist-s-view-epidemiological-curve
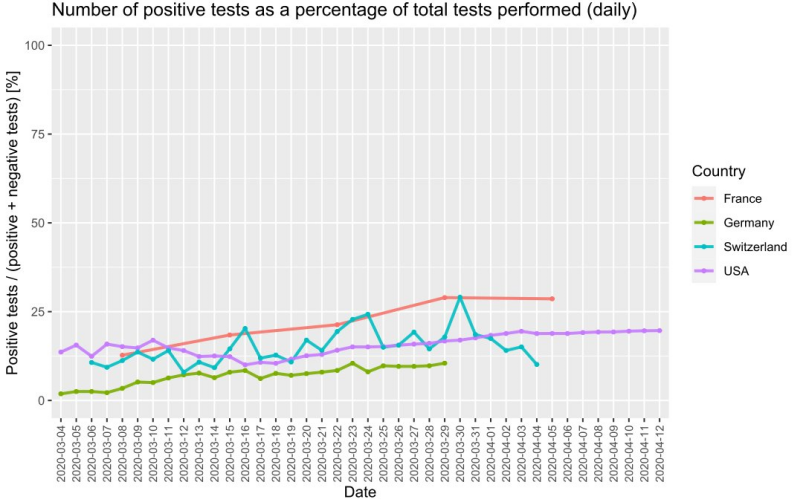
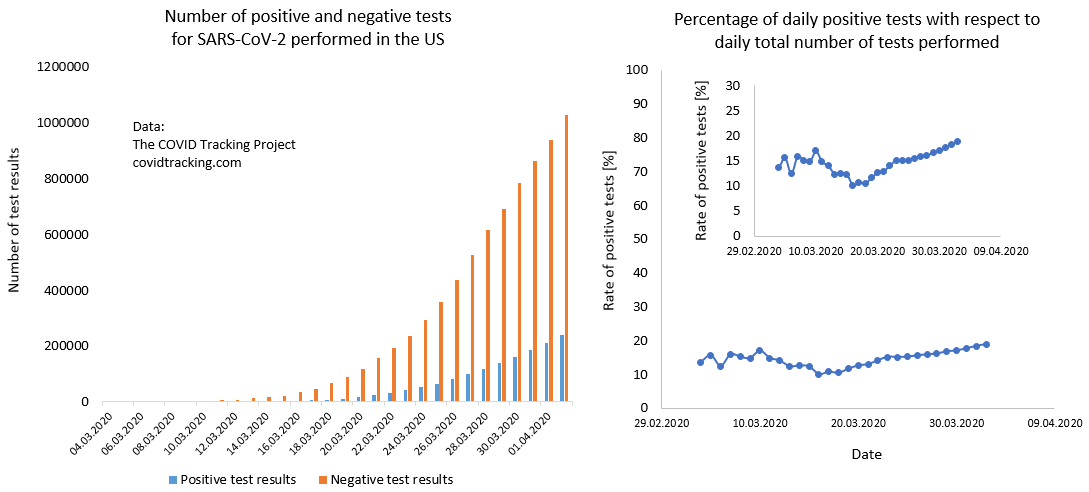
Felix Scholkmann is a biophysicist at University Hospital Zurich, University of Zurich, Switzerland.
Andrew Mather, a mathematician and financier based in the UK, offers a series of videos analysing the COVID-19 data released by various governmental and health bodies.
In this video, he presents how the government had access to data that the case-count growth rate was decelerating long before the UK lockdown.
Curve Analysis
His Primer on Curve Analysis may also be useful.