
“It is the right and duty of every citizen to see what the scientists have said and to analyse it for themselves.”
Lord Sumption, former Justice of The Supreme Court
Statistics and charts can be tricky and they are often used to push a certain point-of-view. However, with some critical thinking and basic school-level mathematics, we are all capable of understanding what the data means. We do not need to be scientists, mathematicians or subject-matter experts to come to sensible and informed conclusions.
Let’s strip away the frightening news headlines and look at what the evidence shows us.
January 2023 note: As of early 2023, mainstream voices who previously championed the COVID-19 measures have started talking about the resulting damage. We have archived this page as evidence that, very early on, information was readily available to all that:
- most have little to fear from COVID-19;
- the hysterical reaction worldwide would do far more damage.
November 2020 note: Charts here may lag but our essential understanding remains the same. This page is now being updated only when significant findings are released. However, we archive new reference sources every few days. Please see our resources listing for up-to-date charts and statistics. Links to recent sources, popular topics and article tags can be found at the bottom of this page.
First published: April 2020 from a list of links compiled in March 2020 that we shared with our personal contacts.
Table of contents
Medical experts
Medical experts and notable scientists have been speaking out against the COVID-19 hysteria since March 2020. This site summarises their views but you can listen to what they have to say directly.


Historically insignificant
While the government responses worldwide to COVID-19 have been unprecedented, the mortality rates from the virus is historically insignificant. According to Johns Hopkins University data, Britain’s overall death toll as of early June 2021 is just under 128,000. That is around 0.18% of the population which means that in a group of 10,000 people, only 18 would have succumbed to the disease.
Furthermore, this figure is made up of people who have died within 28 days of a positive PCR test. Many did not die of the virus itself but due to other reasons. Considering the average age of death is around 80 years old, the majority of these would have been elderly who sadly would not have had much longer to live regardless of the cause. Britain has the fifth highest recorded deaths in the world so the majority of countries would have had far fewer deaths.
The December 2020 Office for National Statistics mortality analysis report for England and Wales show that deaths in 2020 have been higher than the past few years. However, when viewed in context of the past 20 years, the figures from 2020 look nowhere near as frightening as portrayed in the news.

This becomes clearer when we look a little further back in history. UK Column News compiled Office for National Statistics data between 1971-2020 to produce the following chart.
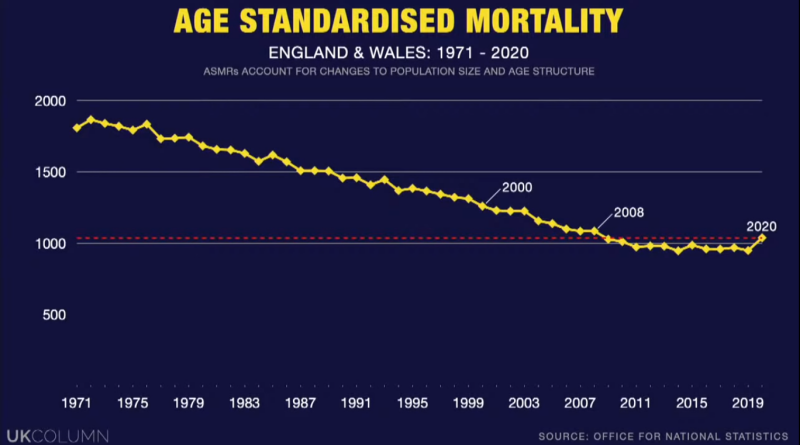
Both charts use age-standardised data which adjusts for the age profile of the population.
A chart compiled by author Rob Slane shows that deaths as a percentage of the population. This shows that 2020 is similar to 2000. Further, deaths between 1959 and 2000 were higher but we did not face society destroying measures.

Five key facts
According to Dr. Scott W. Atlas, we now have enough data to be sure of five key facts about COVID-19:
- The overwhelming majority of people do not have any significant risk of dying from COVID-19.
- Protecting older, at-risk people eliminates hospital overcrowding.
- Vital population immunity is prevented by total isolation policies, prolonging the problem.
- People are dying because other medical care is not getting done due to hypothetical projections.
- We have a clearly defined population at risk who can be protected with targeted measures.
Dr. Scott Atlas is the David and Joan Traitel Senior Fellow at Stanford University’s Hoover Institution and the former chief of neuroradiology at Stanford University Medical Center.
The epidemic is over
The statistics from around the world show that the COVID-19 emergency is effectively over. Data from UK Government Coronavirus Dashboard shows that COVID-19 deaths in the UK are still well below the April peak.
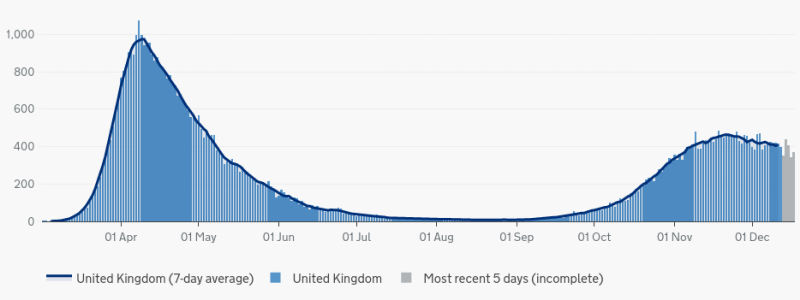
NHS England also shows deaths in England reached its peak around April 2020. Hospitals were not overwhelmed, mortality rates were nowhere near as high as initially predicted and there has been no second-wave of deaths observed in any country.
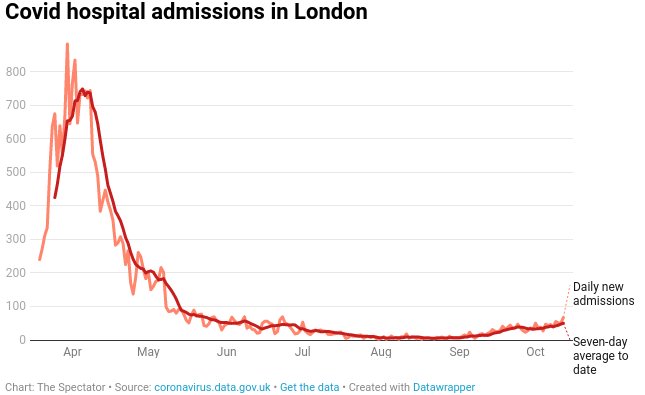
During the height of the outbreak, hospitalisations in London peaked at 880 a day. UK Government data shows that numbers in October are less than a tenth recorded in April.

Spikes that are widely reported in the media are cases. COVID-19 case numbers are not a useful metric because test results are known to be inaccurate. A positive test does not mean someone is sick. Further, one person may be tested multiple times thereby generating multiple cases.

The chart above, compiled using data from the European Centre for Disease Prevention and Control and Our World In Data, illustrates how cases have no relationship to deaths. As the worldwide cumulative case totals increase (shown in red), the COVID-19 deaths (shown in blue) remain flat. Deaths from all causes worldwide far exceed deaths from COVID-19.


Quantitative analyst Joel Smalley, charted deaths from all causes including COVID-19 from January to the end of November 2020 using figures from the Office for National Statistics. The latest data shows that as of December 2020, deaths are no-where near the April peak and are very obviously to be plateauing. This is confirmed by daily excess all-cause deaths data released by Public Health England on 10th December 2020.
Harmless to most people
Public Health England, on their 21 March 2020 update for High consequence infectious diseases (HCID), stated, “As of 19 March 2020, COVID-19 is no longer considered to be a high consequence infectious disease in the UK.” If COVID-19 is not a high consequence infectious disease, why was the UK thrown into uncharted territory without debate?
Nevertheless, despite spending weeks on lock-down; after destroying our economy and businesses; after causing mass unemployment; after inflicting unimaginable suffering to the entire nation, the UK Government again admitted that coronavirus is completely harmless to most people.
On the 11 May 2020 Downing Street Press Briefing, the UK’s Chief Medical Officer, Professor Chris Whitty, confirmed:
“Most people will not get this virus at all. Of those who get symptoms, the vast majority will have a mild or moderate disease. The great majority of people, even in the highest risk groups, will not die.”
The QCovid risk calculator from Oxford University can be used to calculate your risk of death or hospitalisation from COVID-19. As an example, a 75 year-old female with asthma and rheumatoid arthritis has an absolute risk of 0.085%. This means that in a crowd of 10,000 people with the same risk factors, only 8 are likely to catch and die from the disease.
No risk to children
Children have virtually no risk from COVID-19, nor are they a vector of transmission. A study released 7th July 2021 concluded children and young people are at extremely low risk, with equivalent to an infection fatality rate of 5 per 100,000 and a mortality rate of 2 per million.
The chart below compares the number of deaths of those aged 19 and under in England and Wales in 2003 with COVID-19 in 2020. Although there have been deaths among children, those who died were already seriously ill.

England’s Deputy Chief Medical Officer, Dr. Jenny Harries, says that children are at more risk from flu or car accidents. Statistically speaking, they have a greater chance of being struck by lightning than dying of COVID-19.
Infection fatality rate
Multiple studies have found that COVID-19 has an infection fatality rate of between 0.02% and 0.8%. An October 2020 paper by Professor John Ioannidis showed the infection fatality rate for COVID-19 to be around 0.15%-0.2%. This brings it close to seasonal flu which is around 0.1%-0.2%.
The infection fatality rate (IFR) is an estimated death rate in all those who have been infected with a disease. This includes those who have been found to be infected (called ‘cases‘), as well as those who were undetected, either because they have not been tested or are not showing symptoms.
The case fatality rate, on the other hand, is the measure of deaths among diagnosed cases. The mortality rate is the number of deaths in a specific population, such as the population of the United Kingdom, over a period of time.
The IFR tends to give a better overall mortality for non-experts and therefore is increasingly being used by policy-makers.
Comparison with flu
During the start of the COVID-19 panic, we constantly heard the media and politicians saying that comparing COVID-19 with flu is irresponsible. Apparently, COVID-19 is so deadly and spreads so quickly that governments needed to impose unprecedented control over society in order to fight it.
However, as of October 2020 we now know that the median infection fatalatity rate of 0.27% for COVID-19 brings it close to seasonal flu, which is around 0.1%-0.2%.
In terms of risk, COVID-19 is very similar to a bad flu. This is in-line with what epidemiologists, microbiologists and researchers have been telling us since March 2020:
- We should tackle COVID-19 just as we currently do with seasonal influenza. Sick people should stay at home, the vulnerable should be protected but the healthy should get on with their lives as normal.
- COVID-19 is deadly for vulnerable people but anyone at risk from COVID-19 is also at serious risk from flu. Even the common cold may have a death rate as high as 6% in risk groups.
- In some countries COVID-19 may have a lower mortality rate than flu.
- Cases for COVID-19 are not increasing exponentially. Instead, we are seeing an ‘explosion in testing‘ for COVID-19.
- The high death rates in some countries are due counterproductive treatment methods, such as intubation and the use of steroids.
- Some level of social distancing is helpful but a general lock-down and house arrest of the entire population will prove to be a disaster.
Here is what no-one, even officially approved mainstream sources, appears to dispute: in at least of 80% cases, the virus produces either no symptoms or a mild cold-like illness.
Flawed evidence for lock-down
Countries have taken different approaches and there is no evidence that lockdowns have reduced COVID-19 deaths. Inaccurate testing and inconsistent reporting methods is a big problem. We also have no evidence that our NHS would have faced any greater strain when compared to previous flu seasons. In fact, the medical systems of most countries are stretched every flu season.
In the UK, we are told that a lock-down is needed to ‘flatten the curve’. This was based on unfounded assumptions and flawed Imperial College models that predicted half a million deaths from COVID-19. The report that lead to the lock-down was retracted days after release, with the number scaled down first to 20,000 and then to just over 6,000. Professor Neil Ferguson, the author of the report, has a track record of failed predictions.
Nevertheless, the lockdown was still enforced. Our entire county has been shut down, millions have been made unemployed and businesses are ruined due to flawed models and bad advice.
Non-lockdown vs Lockdown
The graph below, from UK Column news, compares the deaths and cases, between non-lockdown (left) and lockdown (right) countries. A similar chart compares non-lockdown (left) and lockdown (right) states in the US.
We can see that in general, areas that have implemented lockdown have higher death rates.


Note: These charts are outdated. The death numbers have changed and Mexico moved into lockdown after the chart was compiled (see visitor comment 16 May 2020). They have been left to illustrate the differences between lockdown and non-lockdown areas around April. However, we will update the charts when new versions are available.


A report by J.P. Morgan Quantitative and Derivatives Strategy, released around 20 May 2020, supports the argument that lockdowns did not help stop the spread of the virus. The J.P. Morgan figure 1 chart shows that many US states saw a lower rate of transmission after lockdowns were ended. J.P. Morgan figure 2 shows that most countries saw their infection rates fall after lockdown.
Deaths caused by the lockdown
Alistair Haimes, a data professional who writes for The Critic, posted the chart below showing weekly deaths at home registered with the Office for National Statistics. The majority of these do not have COVID-19 mentioned in the death certificate. It shows a disproportionate number of deaths at home over the 5-year average, indicating that these are likely to have been caused by the lockdown.

Similarly, the InProportion2 project released the following chart showing the proportion of weekly deaths due to COVID-19 in the context of total deaths during the 1999/2000 flu season. The blue bars show the 2020 lockdown deaths not attributed to COVID-19. Interestingly, the fewer people died during the April 2020 peak than in January 2000.

Excess deaths data from Public Health England using Office for National Statistics death registration data shows around 29k of the 60k excess deaths seen in 2020 as of Nov 2020 were at home. Around 90% of these were not due to COVID-19. This tells us quite clearly that lockdown measures caused harm.

Buggy modelling code
Code reviews of the Imperial College modelling software written by Professor Ferguson began to appear in early May 2020. The comments from professional programmers were scathing. They found it badly written, full of bugs and produced random results. One reviewer went on to say:
“This Ferguson Model is such a joke it is either an outright fraud, or it is the most inept piece of programming I may have ever seen in my life.”
Martin Armstrong, 8 May 2020
There is only one reasonable conclusion we can draw from both the lockdown’s results and the code reviews: the British Government’s decision to lock down the country was based on bogus numbers.
Social distancing
Social distancing is a term that has recently gained popularity as the main way to defeat COVID-19. It includes measures ranging from spaced queues at the supermarket to complete lockdown of cities and countries. In this context, we do not equate social distancing with the historically proven practice of protecting vulnerable people from flu-like viruses by isolating them from risk.
What is the scientific rationale for COVID-19 style social distancing?
No evidence for social distancing
According to Professor Joel Hay, PhD Health Economist at University of Southern California, there is no scientific evidence that social distancing prevents the spread of coronavirus. He advocates that we should “do what we always do”: isolate the frail and sick but don’t isolate the young and healthy. According to Professor Hay, herd immunity is how we’ve solved the problem in the past. Social distancing is destroying millions of lives and killing more people than it saves.
He is not alone, other medical experts including Dr. Sucharit Bhakdi, Professor John Ioannidis and Professor Knut Wittkowski, argue that there is no strong evidence for the kind of social distancing advocated by the UK government.

Two metre rule
The social distancing rules adopted by different countries is arbitrary and has no scientific basis. Different countries use different rules ranging from the WHO‘s recommended three feet (just under one metre) in Sweden and Austria, 1.5 metres in Germany and The Netherlands, to two metres in the UK and US.
Robert Dingwall from the New and Emerging Respiratory Virus Threats Advisory Group (Nervtag) said Britain’s two meter rule was ‘conjured up out of nowhere’ because the government didn’t trust the public to keep 1 metre apart. UK Column, on their 18 May 2020 programme, reported that the two meter distance was Public Health England guideance only for hospital settings. It has no basis for the general the public environment.
Face masks
Many people can now be seen in public wearing face masks. From 15 June 2020, face coverings became mandatory on public transportation. What is the evidence for their use? Currently there seems to be no strong medical consensus on whether face masks actually help.
Physics professor Denis Rancourt published a paper on the science relevant to face masks. After reviewing randomised controlled trial studies with measured outcomes over the last decade, he found that none showed statistically significant advantage to wearing a mask.
Nevertheless some proponents make the claim that masks are valuable for preventing asymptomatic carriers from spreading COVID-19. However, before their unexpected turnaround, the WHO stated that healthy people only need to wear a mask when taking care of a person with COVID-19. Despite claims to the contrary, the science on face masks has not changed.
Further, there seems to be growing evidence that wearing masks at best gives a false sense of security and at worst end up making healthy people more susceptible to getting sick. Dr. Jenny Harries, the UK’s deputy chief medical officer, warned that masks could increase risk of infection:
“For the average member of the public walking down a street, it is not a good idea…In fact, you can actually trap the virus in the mask and start breathing it in. Because of these behavioural issues, people can adversely put themselves at more risk than less.”
The HM Government’s guidance for restaurants, pubs, bars and takeaway services, published 23 June 2020, stated:
[T]he role of PPE in providing additional protection is extremely limited…face covering may be marginally beneficial as a precautionary measure. The evidence suggests that wearing a face covering does not protect you…evidence of the benefit of using a face covering to protect others is weak.
(Note: that as of January 2021, despite the lack of evidence for face masks in a community setting, this guidance has been changed to fall inline with Government policy.)
Data from the Office for National Statistics, as of October 2020, shows quite clearly that masks make no impact on stopping the spread of COVID-19. If masks are effective, we would see a corresponding impact on the overall influenza and pneumonia deaths after mandatory face coverings were introduced. Instead, we observe two things from the ONS chart on the right:
- Influenza and pneumonia deaths remains stable throughout the summer.
- The five-year average for influenza and pneumonia deaths is not very different from the current statistics.

A Danish randomized controlled trial published in November 2020 reached the following conclusion:
The recommendation to wear surgical masks to supplement other public health measures did not reduce the SARS-CoV-2 infection rate among wearers by more than 50% in a community with modest infection rates, some degree of social distancing, and uncommon general mask use. The data were compatible with lesser degrees of self-protection.
R value
The UK government’s approach to relaxing the lockdown is based on the reproductive value, sometimes referred to as the ‘R value,’ ‘R number‘ or ‘R rate.’ This is a measure of how a disease can spread through a population. The value itself is the average number of people who can catch the disease from a single infected person. For example, an R value of 3 means one person can pass on a virus to three others. If R is below 1, a disease cannot spread enough to sustain an outbreak.
In this video, Sunetra Gupta, Professor of Theoretical Epidemiology at the University of Oxford, explains that we don’t have enough information for the R value for COVID-19.
According to Dr. John Lee, the R value is not a strong enough number to bear the burden of any Government policy. ‘R‘ is an artificial figure calculated using mathematical models which, as he says, “have repeatedly been found to reach wrong-headed conclusions.”

Despite these concerns from experts, the UK Government is using the R value as the measure of whether COVID-19 is under control. We are told that the R value will be used to justify easing lock-down or enforcing local lock-downs throughout the country. However, there is a huge discrepancy with this approach. By the government’s own data, the R value had already dropped below the important threshold of 1 before lock-down was declared. Lock-down therefore did absolutely nothing to reduce the R value.

Testing
A lot has been made about testing for COVID-19 but it is far from straightforward. The death totals can sound shocking when taken out of context so it is important to compare them with the numbers the UK normally faces over a long period of time. Furthermore, as American statistician Nate Silver writes, numbers are meaningless unless you understand how they’re counted.
Types of tests
There are currently two types of tests being used for COVID-19:
- PCR Testing is a lab test used to detect if the virus is currently present in the patient. Sampling requires full personal protective equipment and results can have a long turnaround time. It is also very error prone if not processed properly.
- Antibody Testing, or serological testing, checks if a person has antibodies to the virus. It is intended to detect if the subject has been exposed to the virus in the past. Since COVID-19 is a newly identified disease, manufacturing for COVID-19 tests need to be developed. There is a shortage of test kits and those currently in the market are unreliable.
PCR is not the gold standard
Many news outlets reference PCR testing as the ‘gold standard’ for detecting COVID-19. Although PCR testing is currently being used to confirm an infection, it seems the inventor would have warned against PCR testing to detect a virus.
Dr. Roger Hodkinson, Fellow of the College of American Pathologists, says that PCR was never intended for large scale testing. He describes problems with PCR testing in a May 2021 interview with independent journalist Taylor Hudak. Dr. Hodkinson also explains that Sanger Sequencing is an accurate and verifiable method of testing that should be used.

Testing procedures
The shortcomings of both types of tests means that mass testing is impractical. As a result, many of the novel coronavirus victims we see reported in the statistics are ‘assumed positive’. The hospitals may not have tested the patient for COVID-19 but assumed the death was caused by the virus. The assumption is based on whether a patient presents with COVID-19 symptoms. This is problematic because COVID-19 symptoms are very similar to the flu.
This needs repeating: it is almost certainly the case that the majority of deaths in the statistics were not tested for COVID-19. This makes the statistics you see on the news worse than meaningless. In makes them misleading.
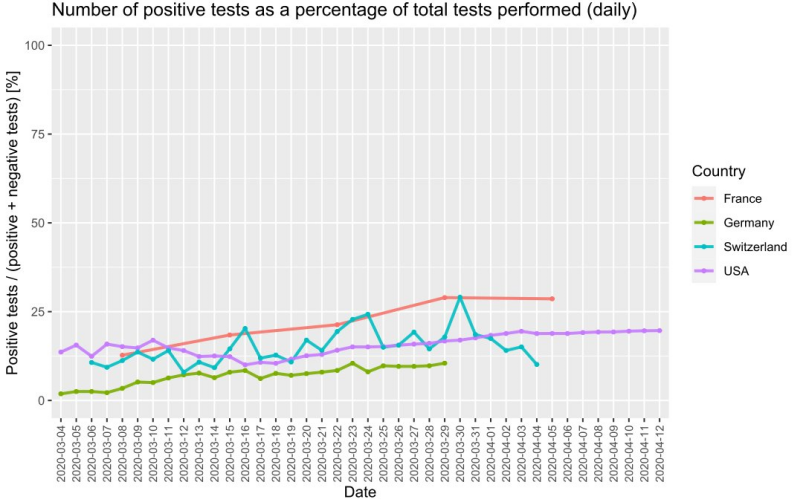
Dr. Wolfgang Wodarg, an epidemiologist and lung disease specialist, explains coronavirus testing in an inverview above. We are also told of the exponential rise in cases but according to Felix Scholkmann, a biophysicist at University Hospital Zurich, test-positive cases were not increasing exponentially in the US, France, Germany and Switzerland during the height of the crisis in early 2020.
False positives
Furthermore, the tests used by most countries have both high false positive and false negative rates. Some are so bad that samples taken from a goat and a pawpaw fruit showed COVID-19 positive. The false positive rate was initially not released by the government but based on similar tests it may be between 1%-2%. This seems small but it has huge consequences.
Experts who know about medical testing, including Dr. Mike Yeadon, warn that we will never escape mandated restrictions if we keep testing. This can be shown by Bayes’ Theorem and how it applies to medical tests. Dr. Yeadon explains a 1% false positive this way:
For every 1,000 people you test, 10 will come back positive, even if they don’t have the virus. If prevalence is only 0.1% as reported by ONS, only 1 in 1,000 will be genuine. This means 9 in 10–in other words 90%–are false.
So, what do we know about COVID-19 testing?
- The numbers are flawed because current testing methods have an unacceptably high error rate.
- Many people counted as COVID-19 victims actually died of something else. (Reports from Italy back this up.)
- The numbers resulting from these tests should not be used to drive public policy.
Government intervention
Some commentators have said that earlier government intervention, such as closing down boarders or locking down sooner, would have stopped COVID-19 in its tracks before it could have become a serious problem.
In contrast, experts in various fields, including Professor Dolores Cahill, Professor Isaac Ben-Israel and Professor Yoram Lass, all say that there is nothing you can do to stop the spread of coronvirus type diseases; they’ll spread and peak regardless of measures taken.
Immunologist Professor Cahill and mathematician Professor Ben-Israel both come up with similar lifespans. Coronavirus epidemics last between 4 to 10 weeks in each location as it circles the globe. As of early June 2020, actual data from different countries with COVID-19 outbreaks have borne this out.
According to Professor Lass, former Israeli Health Ministry chief, “A government cannot stop a virus. What stops a virus is natural immunity. It’s impossible to stop a virus by government decree.”

Statistics
Official mortality rate statistics are publicly available and anyone can download the data for analysis. All the numbers so far show that COVID-19 is far from being a ‘once in a century’ plague. Though the numbers in news reports give the impression of an unprecedented death toll, we can see they are not at all extraordinary when placed in a historical perspective.

Novelist Hector Drummond decided to look at the annual death figures for England and Wales from the Office for National Statistics. After graphing the numbers all the way back to the turn of the twentieth century, he found that the numbers for 2020 (shown on the right) cannot even be considered a major spike over the course of the century. Analysis from other sources below support this view.
EuroMOMO
EuroMOMO is an agency that monitors deaths across Europe. Data provided by EuroMOMO is used by governmental agencies including Public Health England. The chart below compares death levels in Week 2 of 2017 with Week 14 of 2020. The darker blue means more deaths.
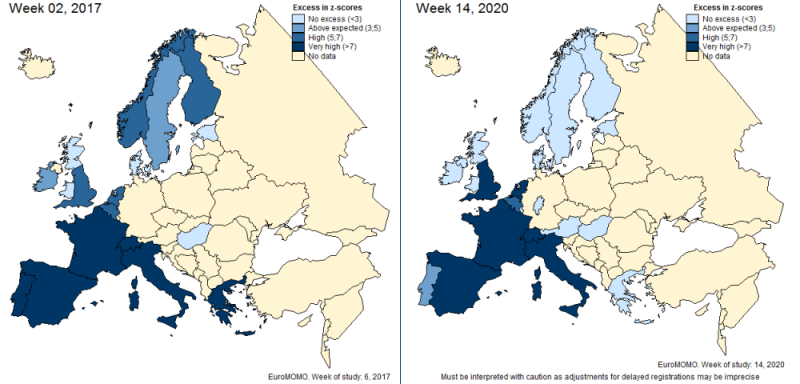
Week 14 and 15 was roughly the peak of the deaths throughout Europe in 2020. How different is the 2017 chart from 2020? If governments did not shut down society in 2017, why are they doing so now?
By week 17, excess mortality in most of the surveyed countries have dropped to moderate or below. The UK, which is holding to its lockdown policy, remains high.

Office for National Statistics
Our commentary on the Office for National Statistics data has been archived separately.
We have made contact with the inProportion2 project which collects and analyses statistics from the Office for National Statistics, National Health Service, Public Health England and EuroMOMO. Please head over there for a more in-depth analysis and comparisons of the numbers.
COVID-19 in proportion
The charts below provide a simple way of viewing COVID-19 deaths in proportion to other deaths.
The InProportion2 chart below compares cumulative totals of COVID-19 deaths with totals for 2000 and 2018. As of late June 2020, we see there is not a huge difference between them. We did not shut down the world economy in previous years yet the entire globe is now at a standstill for COVID-19. Why?

COVID-19 is shown compared to the 1968/69 Asian Flu below.

Understand the numbers
Keep these observations in mind the next time you hear about the rapidly rising death toll on the nightly news:
- Dr. John Lee, a professor of pathology and former NHS consultant pathologist, explains how to interpret the numbers.
- Nate Silver, an American statistician, tells us why coronavirus case counts are meaningless.
- Steve Goodman, a professor of epidemiology at Stanford University, says that confirmed coronavirus cases is an ‘almost meaningless’ metric.
Curve Analysis
The information in this section may take a bit of patience but you’ll be rewarded with the ability to better understand charts.
Andrew Mather, a mathematician and financier based in the UK, offers a series of videos analysing the COVID-19 data released by various governmental and health bodies.
Suggest evidence
If you would like to post some evidence or information that you think would be helpful for other readers, please use the comment form below. The suggestions are moderated and anything off topic may be moved to our discussions page.
Please read our comments disclaimer before posting.
Next steps
By now you will hopefully be reassured that COVID-19 is not a the doomsday virus we hear about in the news. What next?
- Bookmark the resources page to keep up-to-date on the latest news articles and publications.
- Share your opinions, experiences and research with other readers.
- Do not sit back and let others decide your future. Take action now.
73 suggestions on “The evidence”
Great one for showing your experience and knowledge
Very simple, maybe not…..does SARS-CoV2 exist as a bona fide virus?
So the vaccine is made to target the identified virus then if in deed it exists? The elderly, unhealthy are always subject to worse outcomes.
This question alone should be answered and proved from all sides of the academia to settle the matter.
First thank you for this fantastic compilation of evidence based material. Would suggest, that whilst I think it is a beautiful and aesthetically pleasing image, the photo at the top of the page with a street magician is not ideal to inspire confidence in general public who we are trying to reach with this fact based data. Just my 2 cents.
Can you speak to Canada and the fear that the “variants” now pose a threat to the younger generations please?
My wife is, understandably, skeptical that it is safe for her to “venture out”, like going to Church. The last time we did, January 2020, three of our family of four got very sick from the Inluenza B virus, before COVID-19 was diagnosable. And a dear friend, a mother of 10, died within 10 days of being exposed to the Covid-19 “positive” nurse caring for her handicapped child, in spite of valiant efforts to keep her alive, despite all the vitamins she took (D3, C, Zinc). She had heart failure almost immediately and while they had her on artificial support her kidneys failed. Our friend passed Jan 19, 2021.
What can you say to my wife and many others like her to such personal tragedies, showing how dangerous this virus (or whatever it) is?
I am truly very sorry for your personal tragedies. It is the state of our world that people get sick and die and there is nothing anyone can do to change this. In your comment contact you have linked to a site called “OnlyJesusSaves.” If you believe this then I think you have the answer to your own question.
I appreciate this response, thank you. My heart breaks for anyone’s personal tragedy/loss. Most of us have experienced it; however, it is unstoppable. If Patrick is a Christian (which I hope he is), then yes he has answered his own question. Policy/Procedures should never be made based on feelings or individual cases, as tragic as those cases may be. Policy should be based in truth/fact (evidence), not in fear.
I’m sorry for your loss. All deaths are tragedies for family and friends around them, and I don’t believe this website’s purpose is to play them down. There is an MP who talks about his family member dying in their 40s. Here’s the link to his recent interview by Channel 4 and that should put things into perspective. I hope this helps.
https://www.youtube.com/watch?v=vsAFKQhl7bc
Patrick, I hope you and your family are doing well. As a Christian, I believe death (physical and spiritual) entered the world through sin and only Jesus Christ provides eternal life (spiritual) through repentance and forgiveness of sin. If you believe this also, I would suggest Hebrews 9:27 and 2 Timothy 1:7.
1. Doctors/medical/health experts appearing on the major national TV networks parrot the same line – masks, social distancing, lockdowns (as is happening in my home country India). They don’t mention the immune system, nutrition, healthy diet, Vitamin C, D, quick inexpensive life saving treatments like hydroxychloroquine, zinc. They often say “We have to contain the spread of the virus” which I firmly believe is possible only if they prevented the wind from blowing. Why are they being so intentionally dishonest and misleading the public ? (My own college receptionist told me a few doctors are speaking up but the vast majority are being threatened with cancellation of licenses if they speak the truth)
2) I would like more information about the South African and UK variants and how to deal with them
3) Are you on facebook, youtube?
4) Do epidemics have a time frame – months, years and phases – initial phase, rise, plateau, decline ?
5) If Covid symptoms are vastly similar to flu – cough, cold, fever, body weakness, headache, why is it being given apocalyptic status ?
This website is a god send. Thank you so much and keep up the sterling work. What a pity there is nothing like this in India
Do you mention Kary Mullis’ views on the PCR test? In particular with regards to HIV and genomic sequencing. Also, do you mention the source of the genetic sequencing from a wuhan algorithm and that a virus has never been isolated from an infected human? Thank you for you website, I have shared it regularly over the last year, you are truly empowering many people to liberate themselves. Peace!
Please create some social media accounts, that way you can post some of these great resources/charts/facts which can be widely shared. This site is great, but I can’t share it quickly/widely with people and followers.
Lee. Clearly you are not aware of the almost complete censorship of anything not in line with the official narrative (Corona virus is dangerous, stay home, keep your mask on, low cost treatments do not work, etc). As a test, try searching for the interview with David Icke on London Real using Google, or even someone like Vernon Coleman.
There is absolutely no point in putting any of this on social media. It will vanish from Youtube, Facebook, and Twitter before you can share it.
Can you please add the Danish mask study from yesterday? (ref. Annals of Internal Medicine 18 Nov 2020)
https://www.acpjournals.org/doi/10.7326/M20-6817
Hello, i would like to suggest 25 links to scientific, peer reviewed studies that show the ineffectiveness of facemasks and the negative effects on health.
https://bmjopen.bmj.com/content/5/4/e006577.full
https://www.ncbi.nlm.nih.gov/pmc/articles/PMC4420971/
https://pubmed.ncbi.nlm.nih.gov/18500410/
https://pubmed.ncbi.nlm.nih.gov/15340662/
https://clinicaltrials.gov/ct2/show/NCT00173017
https://pubmed.ncbi.nlm.nih.gov/18331781/
https://www.nature.com/articles/s41598-018-35797-3
https://pubmed.ncbi.nlm.nih.gov/31479137/
https://bmjopen.bmj.com/content/5/4/e006577#T1
https://pubmed.ncbi.nlm.nih.gov/21477136/
https://pubmed.ncbi.nlm.nih.gov/28039289/
https://bmjopen.bmj.com/content/5/4/e006577.long
https://pubmed.ncbi.nlm.nih.gov/20584862/
https://pubmed.ncbi.nlm.nih.gov/22188875/
https://pubmed.ncbi.nlm.nih.gov/31479137/
https://pubmed.ncbi.nlm.nih.gov/27531371/
https://pubmed.ncbi.nlm.nih.gov/29855107/
https://pubmed.ncbi.nlm.nih.gov/29678452/
https://pubmed.ncbi.nlm.nih.gov/25806411/
https://pubmed.ncbi.nlm.nih.gov/23108786/
https://pubmed.ncbi.nlm.nih.gov/25858901/
https://pubmed.ncbi.nlm.nih.gov/5333967/
https://journals.plos.org/plosone/article?id=10.1371%2Fjournal.pone.0002691
https://academic.oup.com/annweh/article/54/7/789/202744
https://pubmed.ncbi.nlm.nih.gov/27531371/
Do get someone to run through your otherwise excellent website and check for spelling errors and typos! (boarders instead of borders?). I spotted a few here and there. also, updated figures/charts now needed in some areas?
Thanks and you are right. This is needed but site is being maintained in our spare time so we have limited capacity. With all the constantly updated information, actually turning out to be a almost full-time job. We do have one visitor who kindly notifies us when she sees something that needs to be fixed.
If you do spot any typos or errors, please do drop me an email at evidencenotfear (at) protonmail (dot) com and I’ll get it updated ASAP. Thanks again.
The U.S. media continue to use hyperbolic language to push a false narrative but when you dig into the real numbers it’s anything but doom and gloom. The experts (and media) kept saying “wait, just wait the number of deaths is going to skyrocket.” Ok, let’s look at the September 2020 “2nd wave” compared to the previous peak in April 2020. For the sake of argument, let’s assume the data is clean (which it isn’t).
Average April cases/day: 29,176.3
Average April death/days: 1,926.53
Average September cases/day: 40,020.34 (+137%)
Average September deaths/day: 773.09 (-60%)
And since the beginning, the concern has been a “surge” in hospital admissions but CDC’s own data doesn’t support that argument with only 1.8% of emergency room visits being coded as COVID-like which means over 98% of ER visits are something else: https://covid.cdc.gov/covid-data-tracker/?CDC_AA_refVal=https%3A%2F%2Fwww.cdc.gov%2Fcoronavirus%2F2019-ncov%2Fcases-updates%2Fcases-in-us.html#ed-visits
Why has there not yet been one conclusive evidence from all the world’s leaders/UN as to where this virus dominated from and if it is a wet market bat mutated virus or a lab-leaked manmade virus, or another origin?
Surely our leaders would want to hold a nation or someone to account in a World tribunal for crashing the world’s economies, mass genocide, 40% of world businesses permanently closed, locking the world down, borrowing $/£/€ billions more than normal annually, causing millions more joblosses, divorces, suicides, holidays, weddings and other event cancellations and home repossessions?
If the world leaders aren’t interested in coming to one outright conclusion, us citizens of the world would like to know!!
Very well put together with a lot of hard work, no doubt. Gratitude for that. I just wonder in all this, are there ultimately legal responsibilities due, if it can be proven in a court of law, that those involved with making the current government policy have deliberately mislead the public? Your detailed work looks to me like a very strong framework of evidence that could very well stand up in a prosecution. That’s not to say it must be pursued, rather to persuade those misleading the public that their actions are not absolved from responsibilities and legal repercussions and therefore take a more practical, and dare I say, holistic approach, as opposed to a detached elementalist route with this situation.
Thank you very much. This is a good question. I know Lord Sumption and Baroness Brenda Hale, who have both served on the UK Supreme Court, as well as barrister Francis Hoar, have been speaking out about the legal implications.
There is also a website laworfiction.com providing information for ordinary citizens.
Where this will all go in terms of government policy is anyone’s guess.
Wearing a mask is no great hardship but destroying businesses and livelihoods by lockdown is lethal and criminal
Hi
Congratulations on the hard work invested in this web site!
Two suggestions:
1. I think you could/should make more of the false positive rate making the case numbers highly dubious. Lockdown Sceptics has lots on this topic. HandyCock has admitted FPR=0.8-2% which means at the current test rate, the majority of cases could be false. I read today that a swab from a piece of fruit has tested positive!
2. I am sure you have seen this youtube presentation from Ivor Cummins, but in case not…. https://youtu.be/8UvFhIFzaac
Keep up the great work.
Thank you. Yes, more detail about false positive rate is on the list but short on resources. Thanks for the video for Ivor Cummins’ video.
Hi there, I was wondering if you could provide the sources you’re using to state that “Here is what no-one, even officially approved mainstream sources, appears to dispute: in at least 80% cases, the virus produces either no symptoms or a mild cold-like illness.” In research I’ve found, asymptomatic cases are dramatically lower (6%): https://www.acpjournals.org/doi/10.7326/M20-2671
This issue of asymptomatic carriers is a big deal for those of use trying to end the mask nightmare. Would like to hear how you approach this. Thank you kindly,
This quote of at least 80% having no symptoms or mild cold-like illness was so common in the early days that we didn’t even feel the need to link to the source. If I recall correctly, it was stated plainly on the BBC, NHS and WHO websites. Interestingly, that quote is now difficult to find!
Fortunately we’ve archived a few sources here:
Articles about asymptomatic cases can be found here.
Hope this helps.
Thank you! What an amazing website. I gift that hopefully helps people reduce their fear dial from 11 to something akin to 1. Something much more in line with reality.
I wanted to suggest a bit more on testing. These 2 articles outline a) that PCR tests are picking up dead virus and b) they are picking up other virus, not just COVID.
Bottom line. Test results are BS but they are driving policy.
https://www.nytimes.com/2020/08/29/health/coronavirus-testing.html
https://principia-scientific.com/covid-19-vaccine-not-possible-for-a-virus-not-yet-identified/
Would it not make sense to form a commitee of all the referenced experts (similar to Germany’s ACU) and try to arrange a press conference to discuss these important facts and demand an end to the extreme measures; as difficult as it clearly is at the moment. I believe all this brilliant information is unfortunately not being communicated to the masses. Would it also be a good idea for all the referenced experts to collaborate and publish a peer-reviewed report, submit it to the Government, and all major media platforms to try to gain some attention. I feel desperate, I feel frustrated that the only messages disseminated are negative ones. There needs to be coordination, organisation, cooperation and action. We need a figurehead to lead it, I’d suggest Lord Jonathan Sumption, he has enough knowledge and is respected enough to be listened to and not labelled a conspiracy nut.
I agree and we all share your frustration. Unfortunately those of us who run this website are ordinary people who do not have the authority to organise such a committee. The best we can do is share the information widely and encourage those with a wide reach to pick up the banner.
Thanks, you’ve cheered me up.
Please join forces with James Todaro and the other doctors of the White Coat Summit, Keep Britain Free, StandUpX. We need to spread the truth everywhere. We need mass new media exposure. I am sharing everywhere.
I think you could include the work of Prof. Michael Levitt in this . He is a Nobel Laureate bio mathematician. I did not see it and might have missed something – my apologies if I did.
He conclusively showed in May that exponential growth never occurs and he has analysed all outbreaks and has been able to accurately predict outcomes by curve fitting using the Gompertz function. He has published this proof in a series of YouTube videos and I included these in my evidence submission to the UK government. Here is my video: https://vimeo.com/440218111
I can provide links to the original source material from Levitt if you need this.
Thank you. Yes, we have Prof. Michael Levitt archived here. However, your video of Prof. Levitt explaining exponential growth would be very useful to include on this page. Could you send links to source videos? Thanks!
Here are the original 3 short videos from Levitt plus another one I found good:
Prof. Michael Levitt (Stanford) shares his analysis of several outbreaks and shows why he did not see exponential growth in the China outbreak (3 short videos) – useful to understand exponential growth
Part 1: https://youtu.be/hCgPf1SuPNY
Part 2: https://youtu.be/Uw2ZTaiN97k
Part 3: https://youtu.be/8aHrx68IT7o
In this enlightening interview with former Australian deputy prime minister John Anderson, Prof. Michael Levitt (Nobel Prize winning mathematician) explains what he has learned about the virus from analysing the numbers right across the globe and gives an optimistic perspective for the future.
https://youtu.be/vi4j1I_ix_c
I also think in the critique section for the Ferguson model you could consider including this piece by Nic Lewis (a climate change modelling expert) who attacked Fergusson’s claim that 3 million lives on Europe had been save by lockdown.
https://judithcurry.com/2020/06/21/did-lockdowns-really-save-3-million-covid-19-deaths-as-flaxman-et-al-claim/
Finally, thank you for putting this site together. It really is a superb resource for this seeking to understand what has been going on.
Great number of useful links. However, for the creators of this site, I’m sure you are aware that YouTube videos dissappear very quickly if they hit a certain number of views, or are identified by “algorithms” or “fact-checkers” as contrary to the official narrative (whatever that is).
YouTube videos that are quoted like all the useful ones above, need to be archived and put on an uncensored platform, so user don’t just get the standard “This video is unavailable … ” message.
Brilliant
Thank you
We have come to the same conclusion
Mi name is Alfonso Longo. I live in Bilbao, Spain.
I have been analizing spanish data related to covid.
My conclussion/hypothesis is:
The nursing homes, their structure and management, explain the impact of the covid-19 pandemic in Spain
DIRECTLY: because of the weight of its mortality (51% of all death people where at nursing homes)
CAUSALLY: because of its effect on the transmission of the virus to the rest of the population
May be you can be interested in reading a draft report of my analysis placed at the following link
https://drive.google.com/file/d/1D13Vyl9V6OmRCX4CiLBGuvFq2_NdRnY5/view?usp=sharing
In dont have any market or lucrative interest about this subject. I am just a citizen looking for the truth, and I appreciate the contribution of people whith knowledge, coherence, and independent thinking.
Please feel free to share this information. I am available to give any needed explanation and to share data.
Best wishes
Alfonso Longo
PhD Engineering
MBA
I have actually started collecting resources so that I have accurate facts and figures for people when discussing this. I agree we only have a short window of time to educate people before it’s too late. As a long time UK Column subscriber, I have seen some of this before so thank you for pulling it all together in a sensible way. Good luck!
Great work done here. Clear concise information. I wish every human could read it and see the scam for what it is. If I’d add anything it would be the fact that the mainstream media in the UK needs to be dismantled. They are an abomination and responsible for most of the fake panic and fear.
Fascinating and totally believable as an explanation of how we have been misled. I am 81 years old, and many moons ago I trained as a mathematics teacher. My principal tutor was a statistician name dVesselo – I have forgotten his first name. But he published several books back in the 1950’s and ’60’s. As he always maintained “there are lies, damned lies and statistics”. I do not think your statistics are misleading at all, and i thank you for the extreme care you have taken in presenting them so well. I do not publish my thoughts on the Social media platforms for my own safety, but i am happy to endorse your conclusions
Just submitted a suggestion about a freely available book on COVID-19 and 10 minutes later found it was deleted ??
The comment was in no way offensive and purely added to provide readers with additional information.
And yet, deleted. What is the point of inviting genuine suggestions if they are deleted?
Will this now be deleted?
You talk about not having fear and then delete suggestions !!
Sorry, your comment was not deleted but was held in the moderation queue.
Comments are moderated and manually approved by a human to filter out spam. We are unfortunately unable to watch the comments 24/7 as we also have day jobs and families. Sometimes it can take a few hours or even the next day for a comment to appear.
If any of your readers are interested I have a freely available book on my website called “COVID-19 and Project Fear” and deals with similar issues relating to this article. I live in the UK and the book has a UK focus. Feel free to download a copy.
https://www.gmseed.co.uk/books/non-fiction/covid-19-and-project-fear
the percentage of COVID 19 deaths of those over 60 years of age suggests that they are particularly at risk. However, if this is compared with age demographics of a pre-COVID period surprisingly there is little difference. In India, 65% of COVID deaths are over 60 years, but if we look at the whole of 2019, the number of deaths from all causes of ALL persons who were 60+ is only slightly lower at 60%! not much of a difference.
Dr Ray Peat a retired PHD Biologist and an endocronologist, science historian also has done a few good youtube videos on the coronavirus scam. He can be reached by email on [email protected].[Email redacted]
What a load of bollocks
Thanks for your insightful comment.
UK population approx 68,000,000. Approx 550000 die in normal years, so 0.8%, ie 8 per 1000 people. Covid will at most kill 75000, but I’ll give you a dramatic 125000 just to make my point, and not even allow for how many of these would have died this year in any case due to age and general ill health. So if 125000 die, that is 0.18%. We have basically trashed western society, economies, mental health, education, business, unemployment etc etc, not to mention the appalling implications for civil liberty, because this year 9 to 10 people per thousand will die instead of 8. Literally, that’s it. Approx 0.8% goes up to 0.98%, probably 0.9% if we don’t use the 125000 figure. The statistics here demonstrate the pointlessness of the whole thing – if no one had ever even mentioned covid, it would have been written off as just a rotten year with a bad flu toll. In fact, no one other than statisticians would even notice, it would barely have registered
This is so true. I’ve done my own research and came to the same conclusions. I decided lockdown was both unnecessary and an illegal infringement of civil liberties and rights, so I decided as far as possible to simply ignore it and just get on with my life. Three months down the line, the economy here in the UK is in tatters, the lives and livelihoods of hundreds of thousands of people have been ruined, and it’s estimated 75% of people will suffer some sort of mental health issue as a result of lockdown. Making an admittedly unscientific survey of people I know, those who took lockdown seriously are now mostly frightened and anxious, terrified to leave their homes, whereas those who just ignored it seem to be resilient and mostly ok, albeit somewhat frustrated with everyone dragging out this Covid 19 thing, when by now we should have moved on and be back to normal. I would like to add that we are all still alive, and that attitude towards lockdown somewhat surprisingly doesn’t appear have a strong relationship with age or underlying medical conditions.
Thank you for creating such a useful and important resource of information.
May I suggest that you change the main banner image of the two people in hazmat kit.
I have received feedback from a few people that I’ve encouraged to visit your site.
Some were initially put off from reading the content as they perceived the image to be sinister and assumed the site would be promoting “conspiracy theories”.
It is a shame to think that this excellent resource may be ignored/overlooked by those who aren’t as open to the idea of anything other than the mainstream narrative.
Surely it is these people that this information needs to reach the most.
Keep up the excellent work.
Warmest regards.
Thanks for the feedback and you are absolutely correct. We have been reviewing the site over the past few weeks and have come to similar conclusions. We’ll be making some adjustments to give a more hopeful initial impression.
As for the graph of “Non Lockdown vs Lockdown”, I am not very sure that Mexico classifies as a country with “no lockdown”. I live in Mexico and the measures we implemented here I think they classify as a lockdown. Of course, I understand this depends on the definition of lockdown and on time when the lockdown was applied. Anyway, I recommend to verify that information.
I believe the UK Column news report that was the source of the chart mentioned Mexico was not at lockdown when they created the chart. I will add a note under the chart if you can send me the dates Mexico started lockdown. Thank you!
Marvellous the way that the Lock vs Non-Lockdown bar chart shows the Swedish deaths per million in green (cos no lockdown) despite it being much higher than Germany and the US. And a graph further down with Covid deaths (MAYBE). Completely biased anti-establishment bullshit from start to finish. Some truths, but a lot of partial truths missing very important caveats. I’ve written a decinstruction of the whole thing just to get it off my chest, but it’s too long for this box.
If you feel you have valid points but cannot post it because of limitations on the comment box, please email us at evidencenotfear (at) protonmail (dot) com. I will be happy to create a dedicated post for it in the discussion section. I will also link to that post from here.
Include comments/ video by Dolores Cahill.
Thank you. I’ve temporary included some here in the comments but will look for the most appropriate section on the next page revisions.
Update 19 May 2020:
YouTube has censored the video. You can find the video on Bitchute:
https://www.bitchute.com/video/Avc6_ftzk3w/
Update 6 June 2020:
Listing for Professor Dolores Cahill
I’m afraid there is a serious technical error which needs correcting in the section above headed ‘types of test’. You have called the serological test ‘antigen’ test – in fact the antigen is the virus, and the antigen test is therefore the pcr test, to see if the antigen is currently present. The second, serological, test is the ‘antibody’ test, which tests to see if you have antibodies, and therefore have had the disease in the past. It is important to correct this mistake, as it gives an unscientific impression which could debase the image of the whole campaign., and make it appear like a mad fringe group.
Thank you very much for your valuable correction. We were following the terminology used here:
However, there does seem to be some confusion with overlapping terminology. I have double-checked with other sources and to avoid confusion, have edited the text to specifically say ‘Antibody Testing.’
We are operating with very limited resources so appreciate efforts like yours to ensure the quality of information presented here.
Kevin. Neither of the tests have any provenance.
Scientifically, we can’t factually talk about a virus being an antigen whenever not a single lab has isolate the virus. The primer for the samples is a mix of tissues and therefore the entire premise of testing with any degree of certainty is fallacious.
I have been searching for the science behind the claim that shut the world down – ‘the asymptomatic spread it.’ Someone forwarded me this yesterday. https://www.eurosurveillance.org/content/10.2807/1560-7917.ES.2020.25.10.2000180?fbclid=IwAR2knkr0PtsJUvw-p6tPQOMQgzXCSM23d-8fPxcvIsTnhk8aTEx1GiSNz9s
Thanks you , I have been doing my own investigation and research but lots of people thought I was nuts ,,
This just proves that I was right and I love this presentation.
The question is is anyone going to be accountable for all this mass destruction of the whole planet economy..scaremongering,and getting so much money out of governments all over the world ,after such a huge hoax just to sell vaccine …William should be arrested …
You’re welcome! We decided to build this site because we were in exactly the same situation as you.
With regard to accountability, it’s important that we share this information with as many people as possible. No-one will be held accountable if most of the population go along with the false claims in the mainstream media. The information is all out there. Most people just can’t be bothered to do their own research and would rather listen to what the news tells them.
One of the useful articles on Dr Malcolm Kendrick’s blogs
https://drmalcolmkendrick.org/2020/04/21/the-anti-lockdown-strategy/
There are many others on lockdown, care homes, statistics, etc.
Suggestions not directly related to this topic have now been moved to the discussions page.
What an amazing resource!!!!! Thank YOU SO MUCH for putting together this brilliant website that raises awareness to educate and empower people. This was so very needed, given how biased the mainstream media is, how fear-filled most people are, and how much control and tyranny have spread throughout our world. I feel so grateful that I found this site by pure luck, and will be happy to share it with others. The format, layout, and resources that you put together are all outstanding. The only suggestion I can think of at this time would be to look at Dr. Pam Popper’s videos on YouTube too, and perhaps including some of them, as she has had excellent info on this whole mess since the start too. Other than that, keep up the amazing work!
Editor’s notes: Comment copied here from Fearless section as readers of this page may be interested in the suggestion. Dr. Pam Popper’s videos on YouTube
Please analyse TOTAL April 2020 deaths and compare these against the April figures for April 2016/17/18/19 (Average these out)
If there is a spike in the data from April 2020 vs the average from 2016-2019 then you can then compare this difference against the COVID death figures reported by the government between 1st-30th April to see how they compare.
You mention that non COVID deaths may ramp up during lockdown but make no mention that in other areas deaths will decrease (Less Road traffic deaths for example, less violence/murders as less people are on the streets. Less other accidental deaths, work place, drownings and so on) Depression Type suicide rates may increase but this may Countered by say less road deaths. It’s nonsensical to even get into this debate unless all aspects were compared.
In summary though, compare April 2020 figures. No point quoting January/Feb figures as we didn’t have Corona related deaths then. March was slow. April it has progressed significantly.
Just a suggestion. Narrative needs to be impartial to let the audience decide rather than pointing the audience in a certain direction.
This site was specifically created to point the audience in a certain direction. It is the direction of questioning the official narrative which did not make any sense at all. As of early May it still doesn’t make any sense.
We started compiling the information here in mid-March. Our goal was to draw attention to things the media was telling us that just didn’t add up. Since then we have made contact with the inProportion2 project which goes into a lot more detail looking at the statistics. Please visit http://inproportion2.talkigy.com for a more in-depth analysis and comparisons of the numbers.
You may also like to look at these resources that report on the real effects of the lockdown.
Charles Low – There clearly is a Flu type Virus going round, nobody is denying that. But over the last 5 years in April there hasn’t been a major Flu outbreak in April – so why compare April figures with other April figures. That’s pointless. You wouldn’t compare the crowd at a football match this week with last week, the stadium may have been empty last week. You would compare the crowd with the crowd of the last match regardless of when it was. The only meaningfull comparison is to compare previous Flu epidemic months with these months.
a man falls from a plane without a parachute… ooh another coronavirus death!
the figures we have been given (by the government) are not worth considering
Impartiality would require an unbiased analysis of all information.
There’s far more here than what you zeroed in on. Including evidence that makes ALL death numbers essential meaningless.
It’s not non-sensical at all.
The topic is the Lockdown, viral deaths (which have dodgy numbers) and the sub-standard science utilised to make sweeping policy decisions akin to medical martial law – dragging us into a new, biosecurity paradigm globally, whereby the assumption is that everyone else is a bioweapon.
We are also not “counter-balancing” one cause of death (viral) against accidental deaths for a mortality head count if sorts, which is ludicrous.
First of all congratulations on your website, it is wonderful to see a site that is seeking to bring all of the non mainstream media facts together in one place.
I don’t have a site myself, but have been doing a lot of exploring on this topic and wondered if the following links would be worth consideration for inclusion on your site.
The High Wire (you tube)
The High Wire (website)
David Icke (you tube)
David Icke (website)
Investigating the Alleged Covid 19 Pandemic
I hope these are helpful