Plastic face shields are almost totally ineffective at trapping respiratory aerosols, according to modelling in Japan, casting doubt on their effectiveness in preventing the spread of coronavirus.
A simulation using Fugaku, the world’s fastest supercomputer, found that almost 100% of airborne droplets of less than 5 micrometres in size escaped through plastic visors of the kind often used by people working in service industries.
In addition, about half of larger droplets measuring 50 micrometres found their way into the air, according to Riken, a government-backed research institute in the western city of Kobe.
Modelling
Browse the articles related to this topic below.
Join our community on Guilded.
I knew a second lockdown was on the cards before we’d had the first one. In mid-March my team at the University of Edinburgh modelled a lockdown that ended in June and was followed by a slow, initially imperceptible rise in cases over the summer, culminating in a second lockdown in late September.
https://www.telegraph.co.uk/news/2020/09/19/uk-needs-follow-swedish-model-learn-live-covid/
The coronavirus pandemic has peaked earlier than expected in many African countries, confounding early predictions, experts have told MPs.
Scientists do not yet know why, but one hypothesis is the possibility of people having pre-existing immunity to Covid-19, caused by exposure to other infections.
Prof Francesco Checchi, a specialist in epidemiology at the London School of Hygiene and Tropical Medicine, told MPs it was “broadly” true that coronavirus had not behaved in expected ways in African countries, including Kenya, Tanzania, Sudan and Somalia.
The number of new infections per day is a key quantity for effective epidemic management. It can be estimated by testing of random population samples. Without such direct epidemiological measurement, other approaches are required to infer whether the number of new cases is likely to be increasing or decreasing: for example, estimating the pathogen reproductive rate, R, using data gathered from the clinical response to the disease. For COVID-19 (SARS-CoV-2) such R estimation is heavily dependent on modelling assumptions, because the available clinical case data are opportunistic observational data subject to severe temporal confounding. Given this difficulty it is useful to reconstruct the time course of infections from the least compromised available data, using minimal prior assumptions. A Bayesian inverse problem approach applied to UK data on COVID-19 deaths and the disease duration distribution suggests that infections were in decline before full UK lockdown (24 March 2020), and that infections in Sweden started to decline only a day or two later. An analysis of UK data using the model of Flaxman et al. (2020, Nature 584) gives the same result under relaxation of its prior assumptions on R.
Sky News host Alan Jones says he has warned time and time again the political leaders who are the architects of this coronavirus response will not be able to escape the criticism that is now finding its way into the public place. It comes as an economist in the Victorian Department of Finance and Treasury, Sanjeev Sabhlok, on Wednesday penned an article in the Australian Financial Review announcing his resignation from his position.
- Policies are a sledgehammer to kill a swarm of flies.
- The Spanish Flu killed killed at least 50 million out of 1.8 billion people out of worldwide.
- To compare with Spanish Flu, COVID-19 would need to kill 210 million people. It has only killed 0.9 million.
- 60 million people worldwide normally die each year.
- There are strong scientific arguments against lockdown.
- The data was clear from February that the elderly should be protected but this wasn’t done.
- Epidemiological models have badly exaggerated the risk.
- There was never any reason to mandate measures such as face masks.
- COVID-19 is no worse than the Asian Flu.
- Lockdowns cannot eradicate the virus.
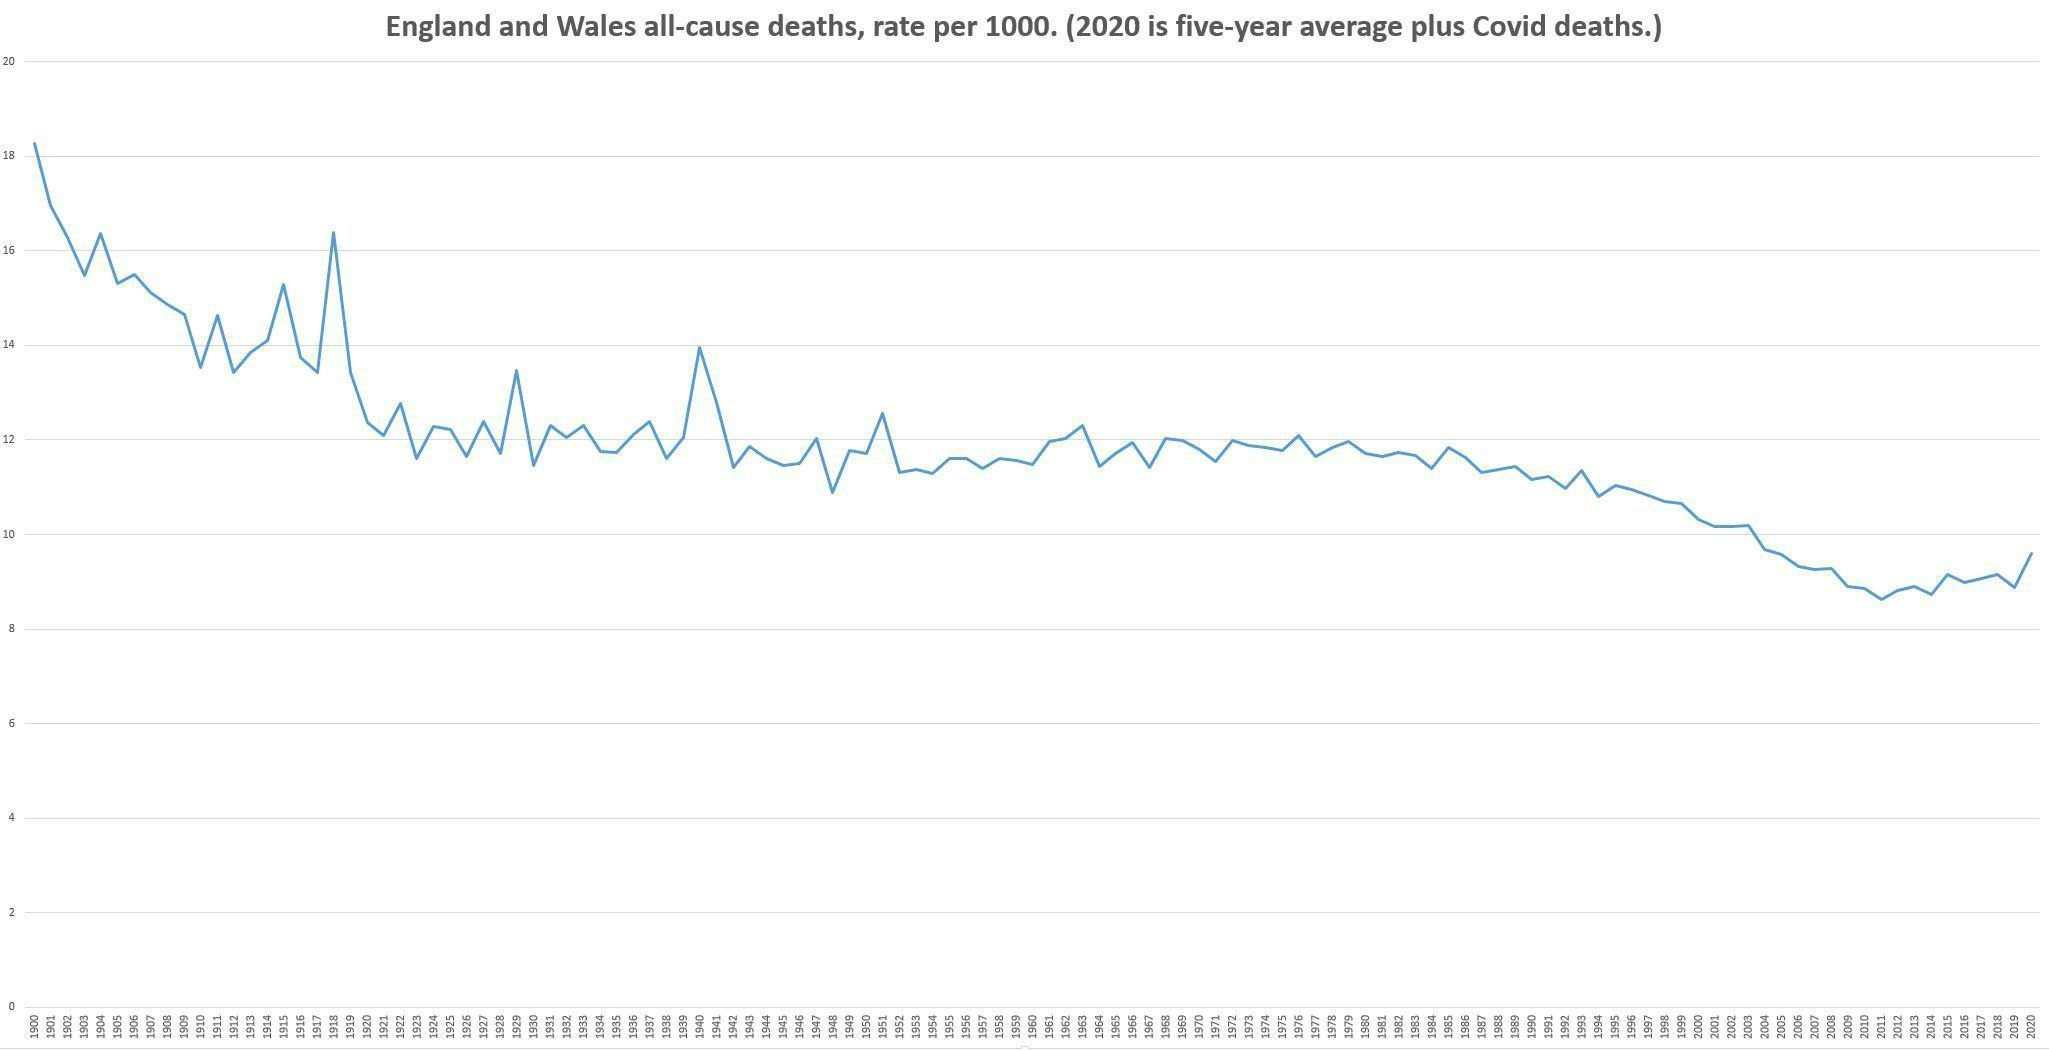
In reality many of the people who died from Covid-19 were likely to die this year anyway, so in one respect this estimate is likely to be too high. In another respect it’s likely to be too low, as it will not include ‘lockdown deaths’, that is, the deaths from delayed cancer and heart treatments, and so on, but as I was interested in the effect of Covid-19 I didn’t want those in my graph anyway. (Another complication is that not everyone who is classed as a Covid-19 death actually died from it, but I decided to ignore this.)
The five year average for 2015-19 is 531,355 deaths per year. As of writing this there were 42,462 Covid-19 deaths in the UK. There are likely to be a few more deaths in the next few weeks, but not many more, as the disease is (barring an unlikely second wave in winter), on its way out. Besides, the number we are adding on here is for the whole of the UK, not just England and Wales, so if anything this number is inflated. That gives us 573,817 deaths for 2020. Then I got hold of the historical population figures for England and Wales, and calculated the death rates per 1000 from it, so that population increases are taken account of. Here is the result:
https://thecritic.co.uk/this-is-what-we-amputated-a-limb-for/
The authors of the commentary, titled “COVID-19 Transmission and Children: The Child Is Not to Blame,” base their conclusions on a new study published in the current issue of Pediatrics, “COVID-19 in Children and the Dynamics of Infection in Families,” and four other recent studies that examine Covid-19 transmission by and among children.
https://www.sciencedaily.com/releases/2020/07/200710100934.htm
Such is the quality of decision-making in the process generating our lockdown narrative. An early maintained but exaggerated belief in the lethality of the virus reinforced by modelling that was almost data-free, then amplified by further modelling with no proven predictive value. All summed up by recommendations from a committee based on qualitative data that hasn’t even been peer-reviewed.
- According to Office for National Statistics, this year comes only eighth in terms of deaths in past 27 years.
- The spread of viruses like Covid-19 is not new. What’s new is our response.
- The whole Covid drama has really been a crisis of awareness of what viruses normally do, rather than a crisis caused by an abnormally lethal new bug.
- Modelling is not science, for the simple reason that a prediction made by a scientist (using a model or not) is just opinion.
- To be classified as science, a prediction or theory needs to be able to be tested, and potentially falsified.
- A problem with the current approach: a wilful determination to ignore the quality of the information being used to set Covid policy.
- Most Covid research was not peer- reviewed.
- In medical science there is a well-known classification of data quality known as ‘the hierarchy of evidence’: a seven-level system gives an idea of how much weight can be placed on any given study or recommendation.
- Randomised controlled trials (RCTs) form the highest, most reliable form of medical evidence: Level 1 and 2.
- Virtually all evidence pertaining to Covid-19 policy is found in the lowest levels (much less compelling Levels 5 and 6): descriptive-only studies looking for a pattern, without using controls.
- Level 7 is at the bottom of the hierarchy (the opinion of authorities or reports of expert committees) because ‘authorities’ often fail to change their minds in the face of new evidence.
- Committees often issue compromise recommendations that are scientifically non-valid.
- The advice of Sage (or any committee of scientists) is the least reliable form of evidence there is.
https://www.spectator.co.uk/article/how-strong-was-the-scientific-advice-behind-lockdown
The death rate from COVID-19 (coronavirus) in Europe appears to be linked to low-intensity flu seasons in the past two years as the same people are vulnerable, says a working paper by Dr Chris Hope, Emeritus Reader in Policy Modelling at Cambridge Judge Business School.
Professor Dr. Beda M Stadler is the former director of the Institute for Immunology at the University of Bern, a biologist and professor emeritus.
Novelty:
Sars-Cov-2 isn’t all that new, but merely a seasonal cold virus that mutated and disappears in summer, as all cold viri do — which is what we’re observing globally right now. Flu viri mutate significantly more, by the way, and nobody would ever claim that a new flu virus strain was completely novel.
Immunity:
In mid-April work was published by the group of Andreas Thiel at the Charité Berlin. A paper with 30 authors, amongst them the virologist Christian Drosten. It showed that in 34 % of people in Berlin who had never been in contact with the Sars-CoV-2 virus showed nonetheless T-cell immunity against it (T-cell immunity is a different kind of immune reaction, see below). This means that our T-cells, i.e. white blood cells, detect common structures appearing on Sars-CoV-2 and regular cold viri and therefore combat both of them.
…almost no children under ten years old got sick, everyone should have made the argument that children clearly have to be immune. For every other disease that doesn’t afflict a certain group of people, we would come to the conclusion that that group is immune. When people are sadly dying in a retirement home, but in the same place other pensioners with the same risk factors are left entirely unharmed, we should also conclude that they were presumably immune.
Modelling:
Epidemiologist also fell for the myth that there was no immunity in the population. They also didn’t want to believe that coronaviri were seasonal cold viri that would disappear in summer. Otherwise their curve models would have looked differently. When the initial worst case scenarios didn’t come true anywhere, some now still cling to models predicting a second wave.
Asymptomatic transmission:
The term “silent carriers” was conjured out of a hat and it was claimed that one could be sick without having symptoms.
The next joke that some virologists shared was the claim that those who were sick without symptoms could still spread the virus to other people…But for doctors and virologists to twist this into a story of “healthy” sick people, which stokes panic and was often given as a reason for stricter lockdown measures, just shows how bad the joke really is. At least the WHO didn’t accept the claim of asymptomatic infections and even challenges this claim on its website.
Testing:
So if we do a PCR corona test on an immune person, it is not a virus that is detected, but a small shattered part of the viral genome. The test comes back positive for as long as there are tiny shattered parts of the virus left. Correct: Even if the infectious viri are long dead, a corona test can come back positive, because the PCR method multiplies even a tiny fraction of the viral genetic material enough [to be detected]…The crux was that the virus debris registered with the overly sensitive test and therefore came back as “positive”. It is likely that a large number of the daily reported infection numbers are purely due to viral debris.
Kawasaki Syndrome:
If an infected person does not have enough antibodies, i.e. a weak immune response, the virus slowly spreads out across the entire body. Now that there are not enough antibodies, there is only the second, supporting leg of our immune response left: The T-cells beginn to attack the virus-infested cells all over the body. This can lead to an exaggerated immune response, basically to a massive slaughter; this is called a Cytokine Storm. Very rarely this can also happen in small children, in that case called Kawasaki Syndrome. This very rare occurrence in children was also used in our country to stoke panic. It’s interesting, however, that this syndrome is very easily cured. The [affected] children get antibodies from healthy blood donors, i.e. people who went through coronavirus colds.
Second Wave:
The virus is gone for now. It will probably come back in winter, but it won’t be a second wave, but just a cold.
Face masks:
Those young and healthy people who currently walk around with a mask on their faces would be better off wearing a helmet instead, because the risk of something falling on their head is greater than that of getting a serious case of Covid-19.
Lethality:
People below 65 years old make up only 0.6 to 2.6 % of all fatal Covid cases. To get on top of the pandemic, we need a strategy merely concentrating on the protection of at-risk people over 65.
https://medium.com/@vernunftundrichtigkeit/coronavirus-why-everyone-was-wrong-fce6db5ba809
Lockdown deaths:
The really concerning thing is that if all the deaths taking place during lockdown are put down as Covid-19 deaths, we are going to miss the fact that the lockdown policies have caused an increase in deaths from many other things. There has been a 50 per cent reduction in people turning up to A&E. It is clear that people just do not want to bother the doctors. And a number of these people will be dying. If we muddle the Covid-19 statistics in with the other statistics, we might think the lockdown has prevented a certain number of deaths, when it has actually caused a large number of deaths.
NHS capacity:
You hear this idea that all NHS staff have been working 20 times as hard as they have ever done. This is complete nonsense. An awful lot of people have been standing around wondering what the hell to do with themselves. A&E has never been so quiet.
The chances of children dying from COVID-19:
How many people aged 15 or under have died of Covid-19? Four. The chance of dying from a lightning strike is one in 700,000. The chance of dying of Covid-19 in that age group is one in 3.5million. And we locked them all down. Even among the 15- to 44-year-olds, the death rate is very low and the vast majority of deaths have been people who had significant underlying health conditions. We locked them down as well. We locked down the population that had virtually zero risk of getting any serious problems from the disease, and then spread it wildly among the highly vulnerable age group.
On vaccines:
It is not clear that getting the virus actually makes you immune to it in the future, and it is not clear a vaccine would either.
https://www.spiked-online.com/2020/06/26/the-lockdown-is-causing-so-many-deaths/
COVID-19 appears to follow the Gompertz curve in every outbreak region. This means that government interventions do nothing to stop the virus.
We demonstrate that universal scaling behavior is observed in the current coronavirus (COVID-19) spread in various countries. We analyze the numbers of infected people in selected eleven countries (Japan, USA, Russia, Brazil, China, Italy, Indonesia, Spain,South Korea, UK, and Sweden). By using the double exponential function called the Gompertz function, fG(x)=exp(−e−x), the number of infected people is well described as N(t)=N0 fG(γ(t−t0)), where N0, γ and t0 are the final total number of infected people, the damping rate of the infection probability and the peak time of dN(t)/dt, respectively. The scaled data of infected people in most of the analyzed countries are found to collapse onto a common scaling function fG(x) with x=γ(t−t0) in the range of fG(x) ± 0.05. The recently proposed indicator so-called the K value, the increasing rate of infected people in one week, is also found to show universal behavior. The mechanism for the Gompertz function to appear is discussed from the time dependence of the produced pion numbers in nucleus-nucleus collisions, which is also found to be described by the Gompertz function.
https://www.medrxiv.org/content/10.1101/2020.06.18.20135210v1
Laura Dodsworth interviews Alistair Haimes on Freethinking with Laura Dodsworth.
Support Laura Dodsworth through Patreon:
https://www.patreon.com/lauradodsworth
Interview notes and charts
- The difference between what the government was telling us and what their information was telling us was so extreme and outrageous.
- Exponential means a “constant rate of growth.” The government data in March was clearly showing that the COVID-19 was declining, not growing exponentially. This was the same in all countries you could see the data. [See chart 1]
- A constantly declining growth rate will make a bell curve. The government were standing in front of bell curve graphs during their briefings yet they were telling us we were in the middle of the epidemic.
- It was very clear that we were heading to a peak sometime around early to mid-April.
- You don’t have to be complicated mathematics to see that COVID-19 was running out of steam almost from day one.
- The conclusion from the Centre for Evidence-Based Medicine seems to be that it’s impossible to predict if there will be a second wave.
- Sweden’s epidemic looks identical to the UK’s but they did not lockdown. Their datapoint indicates there won’t be a second wave. There has been no spike in Denmark either. [See chart 2]
- Unknowns: has summer affected COVID-19 and will there be a mutation?
- Will illnesses during the autumn and winter be mis-attributed to COVID-19? Poor media coverage means that we can’t be sure.
- Symptoms of COVID-19 are very similar to the flu. Something could look like a second wave but will we really know?
- The lockdown is costing a Brexit bill a week.
- The government response seems to have been skewed by Neil Ferguson’s modelling data. The make-up of government advisors seems to be a recipe for groupthink, which is very dangerous.
- Epidemiology (the way a disease spreads through the population) is not complicated science. The government could have had lots of people who were very good at this but they didn’t.
- We should have cocooned the vulnerable, make sure the NHS has capacity and “let it rip” through the population.
- We should never have had an open-ended lockdown.
- The ‘R number’ is just the difference of in the number of people infected after each generation of a disease. Britain crossed the ‘magical R of 1’ line a few days before lockdown and the same day as Sweden. Whatever interventions have been done doesn’t seem to have had any effect. [See chart 3]
- COVID-19 is mostly a care home and hospital disease. This was obvious very early on. Old people should not have been moved from hospitals into care homes. It seems as if we knowingly seeded the most vulnerable environment with the disease.
- 37% of our deaths are care home residents but they are only 0.5% of our population. Of them are dementia sufferers.
- Over 20% of the infections were picked up in the hospitals. COVID-19 seems more like MRSA than influenza in that it’s an infection control problem.
- COVID-19 is much more comparable to flu for the rest of the population.
- 1968 flu killed 80,000 people in the UK.
- This last winter was a low flu winter. It’s quite possible that the people who died of COVID-19 are those who didn’t die.
- If you overlay COVID-19 deaths with the 2000 flu season, they look very similar. [See chart 4]
- 95% of deaths have had another serious disease. Most people have almost no chance of dying from COVID-19.
- If you are under 40, you have more chance of being struck by lightning that dying of COVID-19.
- If you are under 60, you have more chance of drowning.
- At any age, you have more chance of dying on the roads than dying of COVID-19.
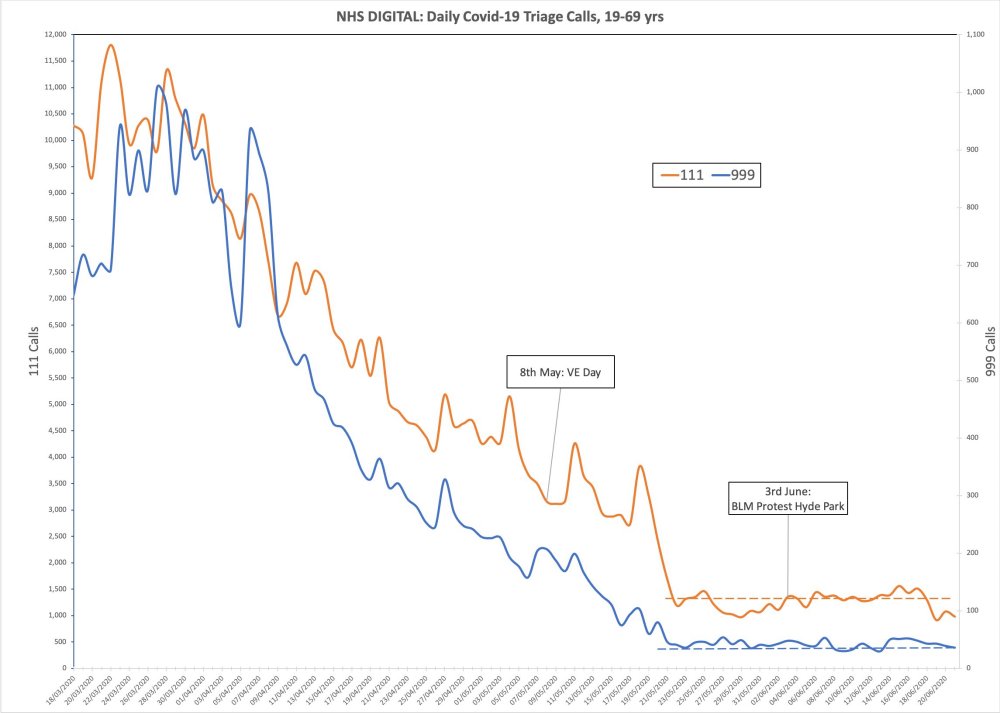
- Lead indicators of 111 and 999 calls with COVID-19 symptoms show there was no spike after VE Day celebrations or BLM protests. In fact, it was even coming down at lockdown. That lockdown was big change for COVID-19 is invisible in the data. [See chart 5]
Charts
Chart 1: COVID-19 was declining in Europe as of march. It was not growing exponentially
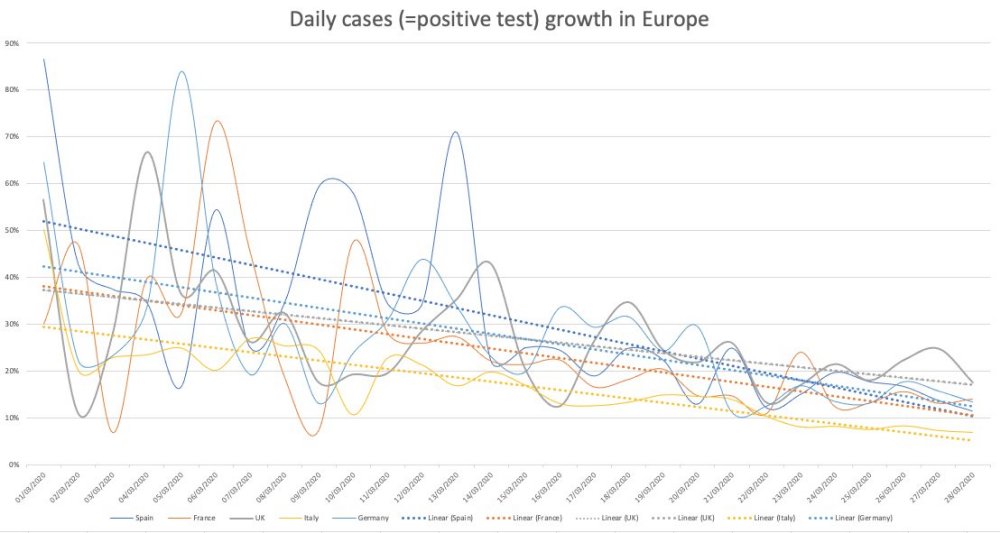
Chart 2: Sweden’s epidemic looks similar to the UK’s but they did not lock down.
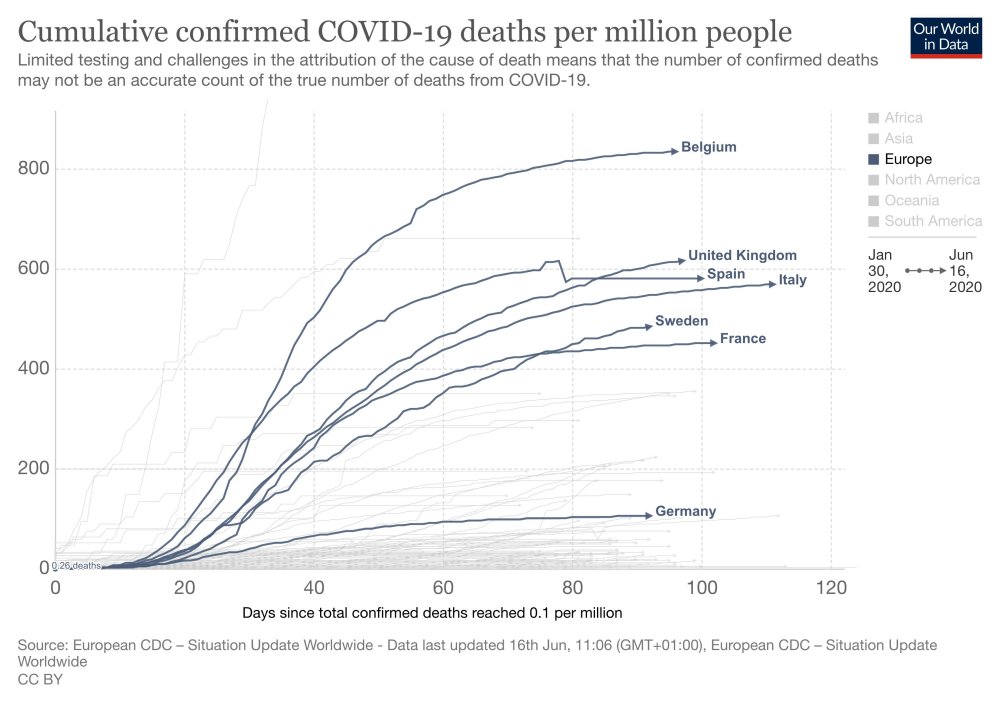
Chart 3: Britain crossed the ‘magical R of 1’ line a few days before lockdown

Chart 4: COVID-19 deaths overlayed with the 2000 flu season
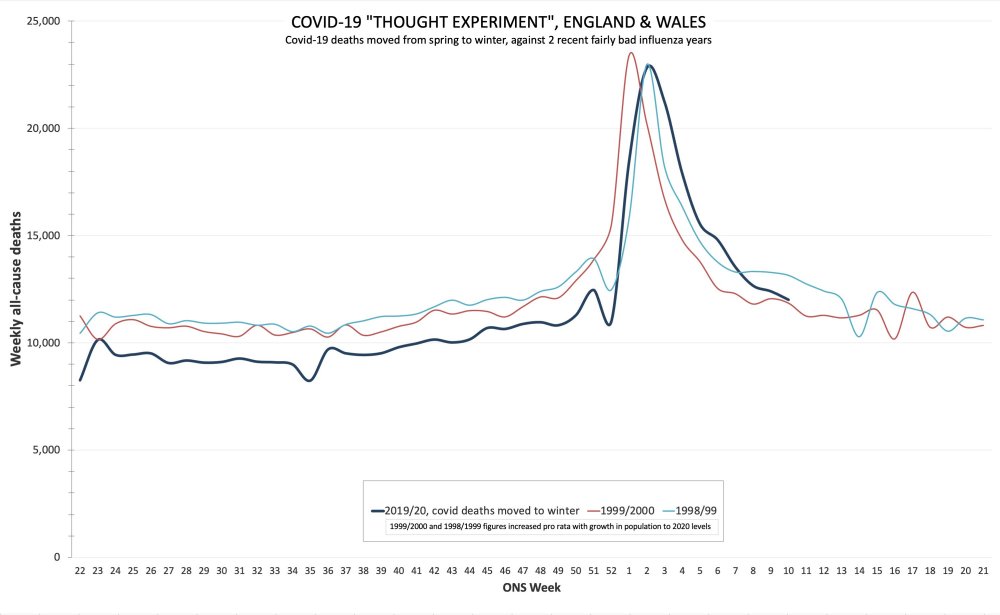
Chart 5: No spike after BLM protests
- Far from following the science, the government turned its back on all available data.
- Until mid-April, with the escalating deaths in care homes agonisingly clear across Europe, government policy was still for patients to be discharged to care homes from hospitals without requiring negative tests. And so the toll: around half of UK Covid-19 deaths are care home residents, despite them accounting for only 0.6 per cent of our population.
- Germany, whose population is roughly 25 per cent bigger than ours, has suffered approximately a quarter of our Covid deaths.
- Ministers have deferred to scientists who themselves deferred to the projections of models, even when data on the ground told a completely different story.
- Statisticians on social media had a field day pointing out the chasm between modelled outcomes and reality, but it is not clear that the models on which SAGE relied (both their input parameters and mechanical dynamics) were continually refined with on-the-ground data (or simply discarded as wrong).
- Why weren’t Oxford’s team, who specialise in zoonotic viruses and who looked at the same data as Neil Ferguson’s modelling-led team but came to wildly different conclusions, on SAGE’s panel to provide an alternative view?
- Why were there no economists on SAGE? Economics is not the bloodless pursuit of money but the science of decision-making under uncertainty where resources are finite; could they really have brought nothing to the party?
- In mid-March, Stanford’s Nobel laureate Michael Levitt (biophysicist and professor of structural biology) discussed the “natural experiment” of the Diamond Princess cruise ship, a petridish disproportionately filled with the most susceptible age and health groups. Even here, despite the virus spreading uncontrolled onboard for at least two weeks, infection only reached a minority of passengers and crew.
- The data towards the end of March clearly showed we were already near the tipping point of the bell-curve (meaning the disease is on the wane). We were already past the point where lockdown could have made much difference.
- Knut Wittkowski: “respiratory diseases [including Covid-19] . . . remain only about two months in any given population”.
https://thecritic.co.uk/issues/july-august-2020/ignoring-the-covid-evidence/
The failure to take into account the impact of extreme measures that have become the norm inmany places in the Covid-19 pandemic has been stunning. The destruction of lives and livelihoods in the name of survival will haunt us for decades.
Today’s fear is fueled by four main forces:
1. Mathematical disease modelling – a flexible and highly adaptable tool for prediction, mixing calculations with speculations, often based on
codes that are kept secret and assumptions that are difficult to scrutinize from the outside.
2. Neoliberal policies –systematic disinvestments in public health and medical care that have created fragile systems unable to cope with the crisis.
3. Nervous media reporting – an endless stream of information, obsessed with absolute numbers, exploiting the lack of trust in the healthcare infrastructure and magnifying the fear of collapsing systems.
4. Authoritarian longings – a deep desire for sovereign rule, which derives pleasure from destruction and tries to push the world to the edge of collapse so that it can be rebuilt from the scratch.
The scientific establishment in this country has had a bad war. Its mistakes have probably made the Covid-19 epidemic, as well as the economic downturn, worse. Britain entered the pandemic late, with lots of warning, so we should have done better than other countries. Instead we are one of the worst affected in Europe and one of the last to begin to recover.
Modelling by Professor Simon Wood, of the school of mathematics at the University of Bristol, shows that the majority of people who died at the peak would have been infected roughly five days before the lockdown was introduced.
By simply separating out weekly reporting variability, the long-term death rate profile becomes clear, and its peak can be located with confidence. Using the distribution of times from disease onset to death, it is possible to extend the model to infer the time course of fatal infections required to produce the later deaths. Because of the wide variability in onset to death times, a quite sharply peaked infection curve produces a death curve that declines only slowly. The inferred infection curve peaks a few days before lockdown, with fatal infections now likely to be occurring at a much-reduced rate.

- There was genuine fear at the beginning but the COVID-19 response is now political.
- Nothing at the beginning of the epidemic justified the subsequent reaction.
- The community suffered from ascertainment bias: hospitals saw the worst form of the virus so they thought we were dealing with a big problem.
- Lockdown means people will be getting nastier versions of the virus.
- We implemented a policy of enormous magnitude without considering the implications. This goes against the most fundamental principle of medicine.
- A significant number of the excess deaths are not victims of COVID-19 but of the lockdown. More than half of the deaths may be found due to other causes.
- The response of the authorities and media has made it impossible to understand what was going on.
- Our huge and emotional overreaction has caused more harm.
- Years of life lost is a more important metric than the number of deaths.
- Most people working in the NHS wouldn’t speak out about these things.
- There were two types of journalism during the epidemic: investigative journalism and illustrative journalism (propaganda). Most of the mainstream media were engaged in propaganda and ended up frightening the people and the government. They need to take their share of the responsibility of the damage caused.
- COVID-19 is nowhere near as bad as previous epidemics.
- The medical establishment should have been speaking out since the beginning of the lockdown. The evidence was pretty clear, pretty quickly.
- Vaccine is a red herring because it’s unlikely we’re going to have one. The Common Cold Research Institute spent 43 years trying to make a vaccine for the common cold and didn’t manage it.
- Track and Trace is extremely worrying and not thought-through with its implications for a Big Brother society. None of it makes sense.
- Social distancing is nonsense. Vulnerable people should be given information and allowed to make their own decisions.
- The NHS is there to protect us. That’s what we pay our taxes for.
- Young people are being thrown in the scrapheap for a disease that isn’t going to affect them.
- As you get older, your immune system starts to ‘forget’ diseases you’ve already had. That’s why older people are more susceptible to getting sick.
- We can say with absolute certainty that there is no overwhelming risk. It’s wrong to say the opposite.
- Many doctors are smart but don’t have a huge amount of time to question things. Most doctors get their information in the same way most people do and unfortunately that information has been very biased. The science has moved on but the narrative has not.
- The media was responsible for amplifying the fear about something they didn’t know about.
- Models are useful scientifically when you have an understanding of something but they’re very bad at predicting outcomes. The government should have known this because we’ve have many examples of models and resulting policies being spectacularly wrong.
- Politicians have forgotten that leadership is not about telling people what they want to hear. Where is the criticism of the narrative?
- There is no evidence that lockdown has had any effect except in modelling. The evidence show that the lockdown plays out in similar way.
Professor Karl Friston is a computer modelling expert, world-renowned for his contributions to neuroscience. He has been applying his “dynamic causal modelling” approach to the Covid-19 pandemic, and has reached some startling results.
– The differences between countries are not primarily down to government actions, but due to ‘intrinsic’ differences in the populations
– We don’t yet fully understand what is driving it, although there are theories ranging from levels of vitamin D to genetic differences
– In each country, there appears to be a portion of the population that is ‘not even in the game’ – that is, not susceptible to Covid-19. This varies hugely between countries
– In the UK, Professor Friston estimates that portion to be at least 50%, and probably more like 80%
– The similar mortality results between Sweden (no lockdown) and the UK (lockdown) are best explained by the fact that in reality there was no difference
– the impact of the legal lockdown in Professor Friston’s models “literally goes away”.