CORONAVIRUS hospital admissions were over-counted at the peak of the pandemic as recovered patients returning to wards without Covid were included in the stats.
An investigation for the Government’s Science Advisory Group for Emergencies (Sage) found that people were being counted as ‘Covid hospital admissions’ if they had EVER had the virus.
Government figures show that, at the peak of the pandemic in early April, nearly 20,000 people a week were being admitted to hospital with coronavirus – but the true figure is now unknown because of the problem with over-counting.
This over-counting mirrors the problems with data for coronavirus deaths – where people who had died of other causes were being included in Covid-19 statistics if they had once tested positive.
Professor Graham Medley, of the London School of Hygiene and Tropical Medicine, asked by Sage to look into the situation, told The Telegraph: “By June, it was becoming clear that people were being admitted to hospital for non-Covid reasons who had tested positive many weeks before.
“Consequently, the NHS revised its situation report to accommodate this.”
A review will examine reports that officials were “over-exaggerating” the number of deaths from coronavirus.
On July 17, the Health Secretary asked PHE to urgently investigate the way daily death statistics had been reported, leading PHE to say it was “pausing” the daily release.
Under the previous system, anyone who has ever tested positive for the virus in England was automatically counted as a coronavirus death when they died, even if the death was from a car accident.
Weekly rather than daily counts could help improve accuracy for future death counts, but could also make it harder to draw comparisons in the event of a second wave of the virus.
Prof Carl Heneghan, director at Oxford’s Centre for Evidence-Based Medicine, has called for a cut-off period for the way the death toll is calculated in England of 21 days.
Chris Whitty, the chief medical officer, reportedly holds the view that excess deaths are the best measure to use, which will be unaffected by the PHE review.
Public Health England was miscounting coronavirus death, official review found.
Could see up to 4,000 deaths removed from England’s official toll of 41,749, or 10 per cent.
Ministers count victims as anyone who died after ever testing positive for Covid-19 — even if they were hit by a bus after beating the disease months later.
The statistical flaw was uncovered by Oxford University’s Professor Carl Heneghan and Dr Yoon Loke, from the University of East Anglia.
The Office for National Statistics, another Government agency, also records Covid-19 deaths, and is considered the most reliable source.
The ONS — which is not affected by the counting method — has confirmed at least 51,596 people have died in England and Wales up to July 24.
Around 58 Brits are now succumbing to the life-threatening infection each day, on average.
The deaths data does not represent how many Covid-19 patients died within the last 24 hours — it is only how many fatalities have been reported and registered with the authorities.
Department of Health bosses say 820 Britons are now being struck down with the life-threatening virus every day, on average. The rate has been rising since dropping to a four-month low of 546 on July 8.
The number of patients being admitted to hospital has yet to spike, bolstering claims from top scientists that the outbreak is not getting worse and cases are only rising because more patients are being tested.
Just 109 coronavirus patients were admitted for NHS care across the UK on August 2 — a figure which has barely changed throughout July. During the darkest days of Britain’s crisis in April, around 3,500 patients were needing hospital treatment every day.
Imposing a widespread regional lockdown in the north west was a ‘rash’ decision which is not backed up by the data, an Oxford professor has claimed.
People in Greater Manchester, east Lancashire and parts of West Yorkshire were banned from meeting different households indoors, in a move that Matt Hancock, the health secretary said was ‘absolutely necessary.’
But Professor Carl Henegehan, director of the Centre for Evidence-Based Medicine at Oxford said the figures were skewed by delayed test results and when plotted by the date the test was taken showed no overall alarming rise.
“The northern lockdown was a rash decision,” he said. “Where’s the rise? By date of test through July there’s no change if you factor in all the increased testing that’s going on.
This recent crop of trials added 9,112 participants to the total randomised denominator of 13,259 and showed that masks alone have no significant effect in interrupting the spread of ILI or influenza in the general population, nor in healthcare workers.
The small number of trials and lateness in the pandemic cycle is unlikely to give us reasonably clear answers and guide decision-makers. This abandonment of the scientific modus operandi and lack of foresight has left the field wide open for the play of opinions, radical views and political influence.
2:55 – Masks • Tom Jefferson: “Aside from people who are exposed on the frontlines, there is no evidence that masks make any difference, but what’s even more extraordinary is the uncertainty: we don’t know if these things make any difference…. We should have done randomised control trials in February, March and April but not anymore because viral circulation is low and we will need huge number of enrolees to show whether there was any difference”. • Carl Heneghan: “By all means people can wear masks but they can’t say it’s an evidence-based decision… there is a real separation between an evidence-based decision and the opaque term that ‘we are being led by the science’, which isn’t the evidence”.
9:26 – Pandemic life cycle • CH: “One of the keys of the infection is to look at who’s been infected, which shows a crucial difference when comparing the pandemic theory to seasonal theory. In a pandemic you’d expect to see young people disproportionately affected, but in the UK we’ve only had six child deaths, which is far less than we’d normally see in a pandemic. The high number of deaths with over-75s fits with the seasonal theory”.
14:00 – Covid seasonality • CH: “The stability of the virus is far less when the temperature goes up but humidity seems to be particularly important. The lower the humidity, the more stable the virus is in the atmosphere and on surfaces… It’s now winter in the southern hemisphere, which is why places like Australia are suddenly having outbreaks.”
20:37 – Lockdown • CH: “Many people said that we should have locked down earlier, but 50% of care homes developed outbreaks during the lockdown period so there are issues within the transmission of this virus that are not clear… Lockdown is a blunt tool and there needs to be intelligent conversations about what mitigation strategies can keep society functioning while we keep the most vulnerable shielded”.
25:20 – Nightingale hospitals • CH: “They are the wrong structure. What you need is fever hospitals which were here until around the 1980s or 90s. They were on single floors and had isolation within isolation. Theere were no lift shafts and staff were trained, which meant that everyone was protected from each other… It looks like at leats 20% of people got the infection while they were in hospital”
27:30 – Suppression strategy • CH: “The benefits of the current strategy are outweighed by the harms…When it comes to suppression, only the virus will have a determination in that. If you follow the New Zealand policy of suppressing it to zero and locking down the country forever, then you’re going to have a problem… This virus is so out there now, I cannot see a strategy that makes suppression the viable option. The strategy right now should be how we learn to live with this virus”
32:45 – Response to the virus • TJ: “I am a survivor of four pandemics and for the other three, I didn’t even realise they were going on. People died but nothing changed and none of the fabric of society was eroded like this response… Do I see steps being taken at a European level about learning from our mistakes and changing policies? The answer is no…
39:30 – Politics of the virus • CH: “We as individuals are part of the problem because sensationalism drives people to click and read the information. So it’s a big circle because we’ve created the problem — if we put the worst case scenario out there, we will go and have a look. If you want a solution, you’ve got to get people to stop clicking on this sensationalist stuff”.
43:30 – IFR • CH: “We will be down about where we were with the swine flu: around 0.1-0.3% which is much lower than what we think because at the moment we are seeing the case fatality”. • TJ: “If you look at the whole narrative, it was distorted from the very beginning by the obsession with influenza which was just one or two agents and nothing else existed. We’re no different now”.
Here, it seems that PHE regularly looks for people on the NHS database who have ever tested positive, and simply checks to see if they are still alive or not. PHE does not appear to consider how long ago the COVID test result was, nor whether the person has been successfully treated in hospital and discharged to the community. Anyone who has tested COVID positive but subsequently died at a later date of any cause will be included on the PHE COVID death figures.
By this PHE definition, no one with COVID in England is allowed to ever recover from their illness. A patient who has tested positive, but successfully treated and discharged from hospital, will still be counted as a COVID death even if they had a heart attack or were run over by a bus three months later.
The difference between what the government was telling us and what their information was telling us was so extreme and outrageous.
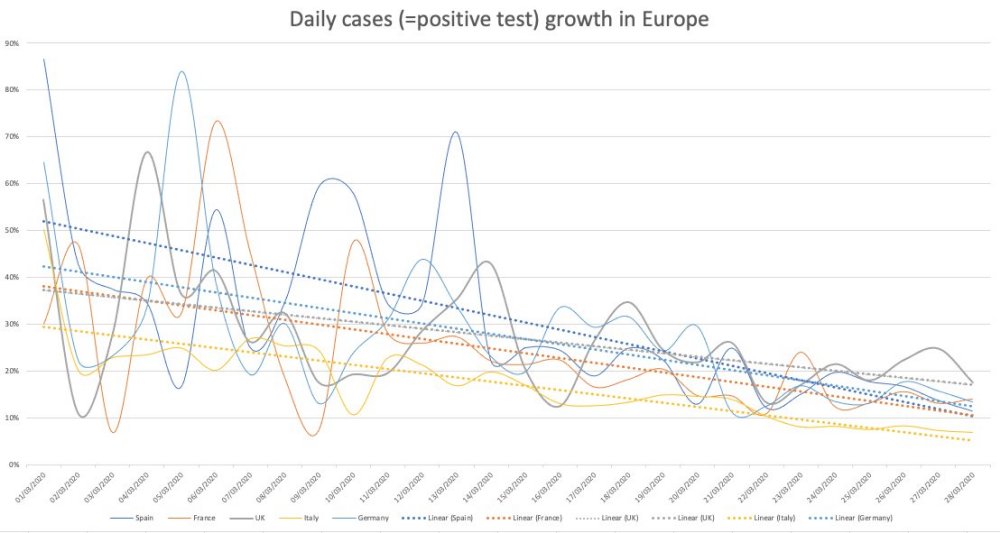
Exponential means a “constant rate of growth.” The government data in March was clearly showing that the COVID-19 was declining, not growing exponentially. This was the same in all countries you could see the data. [See chart 1]
A constantly declining growth rate will make a bell curve. The government were standing in front of bell curve graphs during their briefings yet they were telling us we were in the middle of the epidemic.
It was very clear that we were heading to a peak sometime around early to mid-April.
You don’t have to be complicated mathematics to see that COVID-19 was running out of steam almost from day one.
The conclusion from the Centre for Evidence-Based Medicine seems to be that it’s impossible to predict if there will be a second wave.
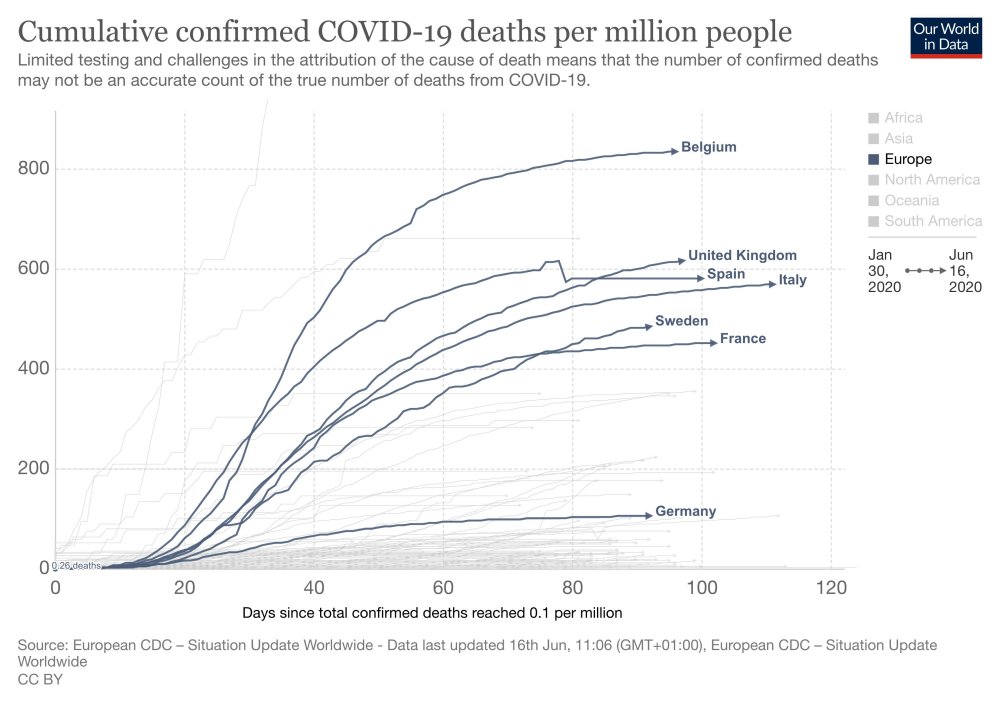
Sweden’s epidemic looks identical to the UK’s but they did not lockdown. Their datapoint indicates there won’t be a second wave. There has been no spike in Denmark either. [See chart 2]
Unknowns: has summer affected COVID-19 and will there be a mutation?
Will illnesses during the autumn and winter be mis-attributed to COVID-19? Poor media coverage means that we can’t be sure.
Symptoms of COVID-19 are very similar to the flu. Something could look like a second wave but will we really know?
The lockdown is costing a Brexit bill a week.
The government response seems to have been skewed by Neil Ferguson’s modelling data. The make-up of government advisors seems to be a recipe for groupthink, which is very dangerous.
Epidemiology (the way a disease spreads through the population) is not complicated science. The government could have had lots of people who were very good at this but they didn’t.
We should have cocooned the vulnerable, make sure the NHS has capacity and “let it rip” through the population.
We should never have had an open-ended lockdown.
The ‘R number’ is just the difference of in the number of people infected after each generation of a disease. Britain crossed the ‘magical R of 1’ line a few days before lockdown and the same day as Sweden. Whatever interventions have been done doesn’t seem to have had any effect. [See chart 3]
COVID-19 is mostly a care home and hospital disease. This was obvious very early on. Old people should not have been moved from hospitals into care homes. It seems as if we knowingly seeded the most vulnerable environment with the disease.
37% of our deaths are care home residents but they are only 0.5% of our population. Of them are dementia sufferers.
Over 20% of the infections were picked up in the hospitals. COVID-19 seems more like MRSA than influenza in that it’s an infection control problem.
COVID-19 is much more comparable to flu for the rest of the population.
1968 flu killed 80,000 people in the UK.
This last winter was a low flu winter. It’s quite possible that the people who died of COVID-19 are those who didn’t die.
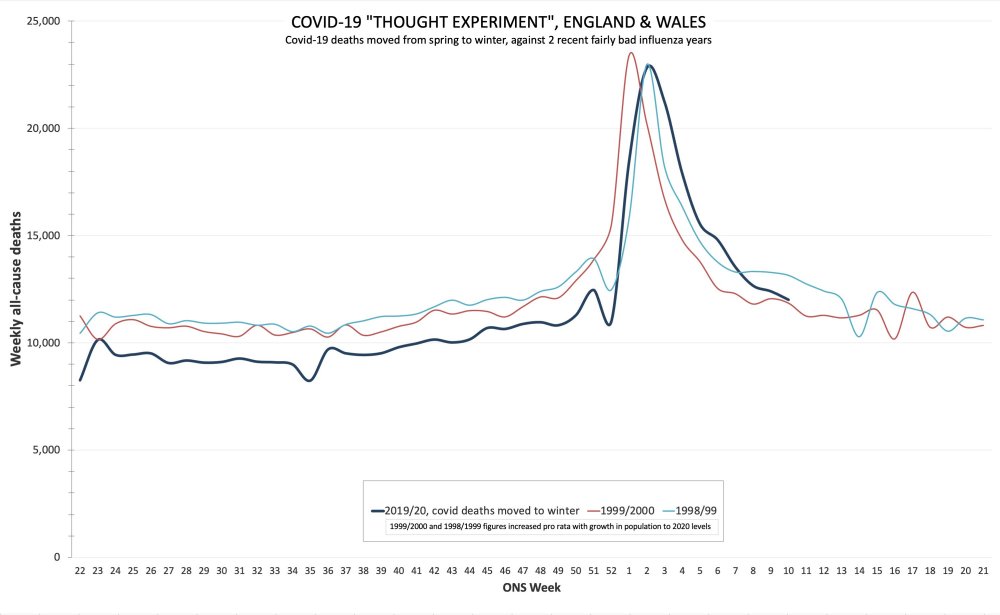
If you overlay COVID-19 deaths with the 2000 flu season, they look very similar. [See chart 4]
95% of deaths have had another serious disease. Most people have almost no chance of dying from COVID-19.
If you are under 40, you have more chance of being struck by lightning that dying of COVID-19.
If you are under 60, you have more chance of drowning.
At any age, you have more chance of dying on the roads than dying of COVID-19.
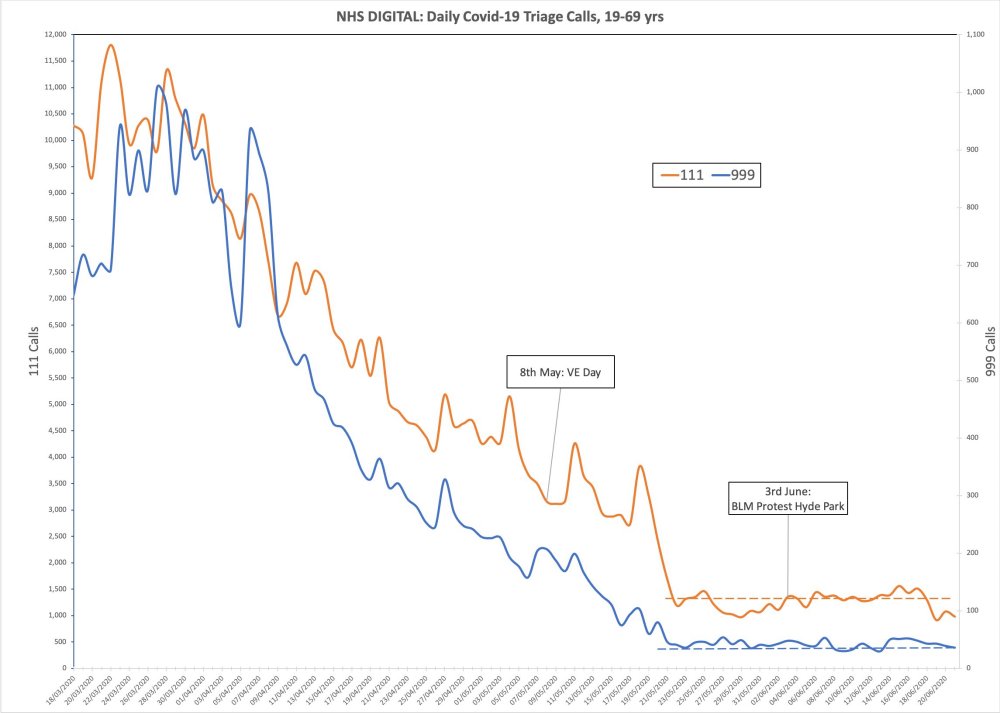
Lead indicators of 111 and 999 calls with COVID-19 symptoms show there was no spike after VE Day celebrations or BLM protests. In fact, it was even coming down at lockdown. That lockdown was big change for COVID-19 is invisible in the data. [See chart 5]
Charts
Chart 1: COVID-19 was declining in Europe as of march. It was not growing exponentially
Chart 2: Sweden’s epidemic looks similar to the UK’s but they did not lock down.
Sweden has had fewer covid deaths per capita than Belgium, Spain, Italy or the UK, and its children <16 have missed no school. @AlistairHaimes, 17 June 2020
Chart 3: Britain crossed the ‘magical R of 1’ line a few days before lockdown
UK Rt (“R number”), late Feb to early April. Lockdown did the square root of nothing. Hand-washing advice early March does look to have caused a massive drop in R, as you’d expect. @AlistairHaimes, 5 May 2020
Chart 4: COVID-19 deaths overlayed with the 2000 flu season
If covid deaths had happened in winter rather than spring. Shown against two recent moderately bad influenza years, for comparison. @AlistairHaimes, 23 June 2020
This page is updated regularly as new information emerges. It sets out the current Case Fatality Rate (CFR) estimates, the country-specific issues affecting the CFR, and provides a current best estimate of the CFR, and more importantly, the Infection Fatality Rate (IFR).
Carl Heneghan, director of the centre for evidence-based medicine at Oxford University, said that the impact of the lockdown was “going to outweigh the damaging effect of coronavirus”.
Oxford University Professor Carl Heneghan: UK’s outbreak peaked in March before lockdown but ministers had ‘lost sight’ of the scientific evidence and panicked.
Traffic log cookies are used to measure site traffic. We'll assume you're ok with this, but you can opt-out if you wish. Cookie settingsACCEPT
Privacy & Cookies Policy
Privacy Overview
This website uses cookies to improve your experience while you navigate through the website. Out of these cookies, the cookies that are categorized as necessary are stored on your browser as they are essential for the working of basic functionalities of the website. We also use third-party cookies that help us analyze and understand how you use this website. These cookies will be stored in your browser only with your consent. You also have the option to opt-out of these cookies. But opting out of some of these cookies may have an effect on your browsing experience.
Necessary cookies are absolutely essential for the website to function properly. This category only includes cookies that ensures basic functionalities and security features of the website. These cookies do not store any personal information.
Any cookies that may not be particularly necessary for the website to function and is used specifically to collect user personal data via analytics, ads, other embedded contents are termed as non-necessary cookies. It is mandatory to procure user consent prior to running these cookies on your website.